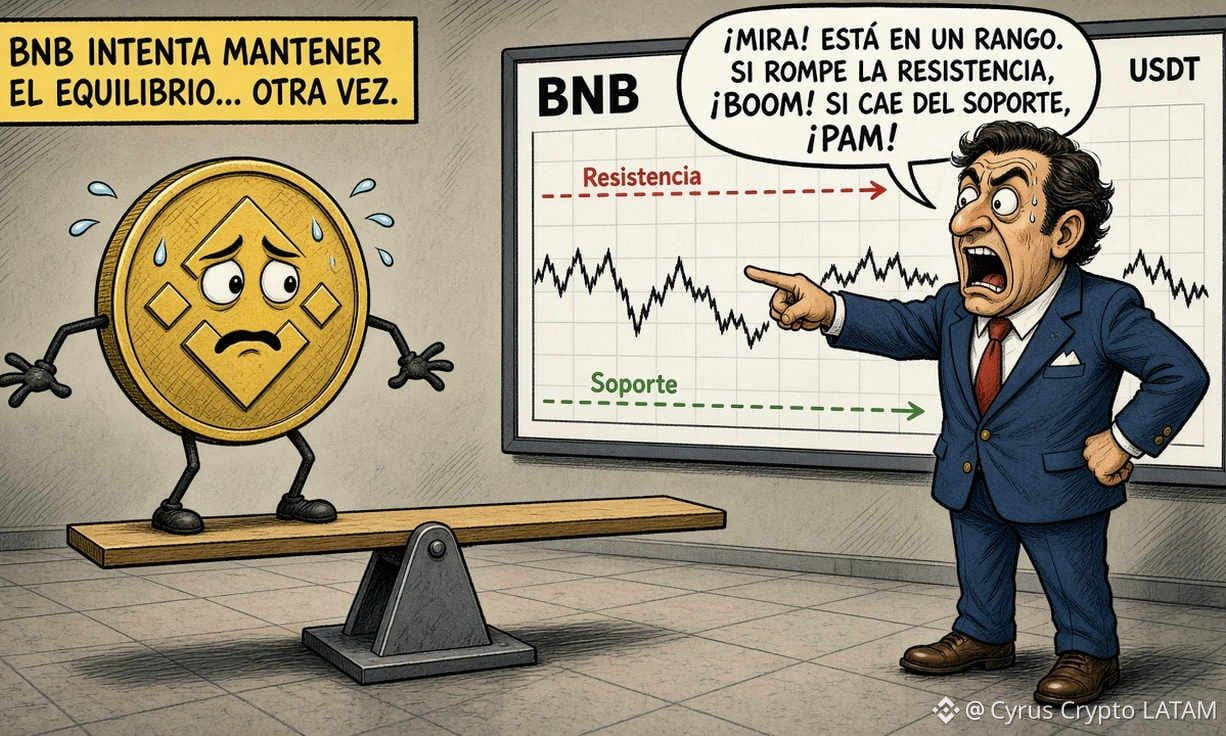
$BNB October 26: price approaches a resistance zone
#bnb is trading at USD $743.52 and showing mixed technical signals: short-term momentum is improving, but the price remains below its 30-day and 50-day moving averages. Volume remains near its monthly average, and there is insufficient evidence to attribute the move to a specific catalyst; levels derived from the day's data and the lack of derivatives metrics call for a disciplined approach.
It is also about 0.53% below today's opening price of USD $747.45; therefore, the direction depends on the time reference used, and the figures show a discrepancy that makes it impossible to describe the balance as an unequivocal decline from the previous close.
BNB serves functions within the BNB Chain ecosystem and is linked to network activity, but the available data do not quantify transactions, fees, active addresses, applications, total value locked, or revenue attributable to the protocol. Therefore, it is not possible to assess whether demand for its use is growing in line with its USD $97.78 billion market capitalization.
Recommendation: HOLD. The methodology weighs five signals: position relative to relevant moving averages, RSI, MACD, volume, and confirmation of levels. Two favor a tactical recovery—price above the SMA-7 and SMA-15, and MACD with a positive histogram—two counsel caution—price below the SMA-30 and SMA-50, and elevated stochastic—and one is neutral, because volume remains near its 30-day average rather than confirming a breakout.
Short term: avoid chasing the price in the middle of the range; consider a tactical entry only after a confirmed move back above USD $751.35, with a stop-loss below USD $732.57 and partial profit-taking within the projected bullish range of USD $751.04–USD $769.21.
BNB combines improving short-term momentum with a clear technical hurdle near USD $751.04–USD $751.35, while the 30-day balance remains negative.