


“Exploring the boundless frontiers of technology; gaining insight into the future and ushering in a new era of investment research.”
This report is provided by the “WTR” Research Institute:
Member XID:
Golden Egg Diary @jindanriji; The Elk Won’t Get Lost @crypto_elk_; Forex Bro; Xibei @Asterismone;

Weekly Review
From October 16 to October 23, Bitcoin peaked near $84,898 and bottomed near $80,513, with a trading range of around 5%.
The distribution chart shows a large volume of coins traded around $80,000, which may provide some support or resistance.
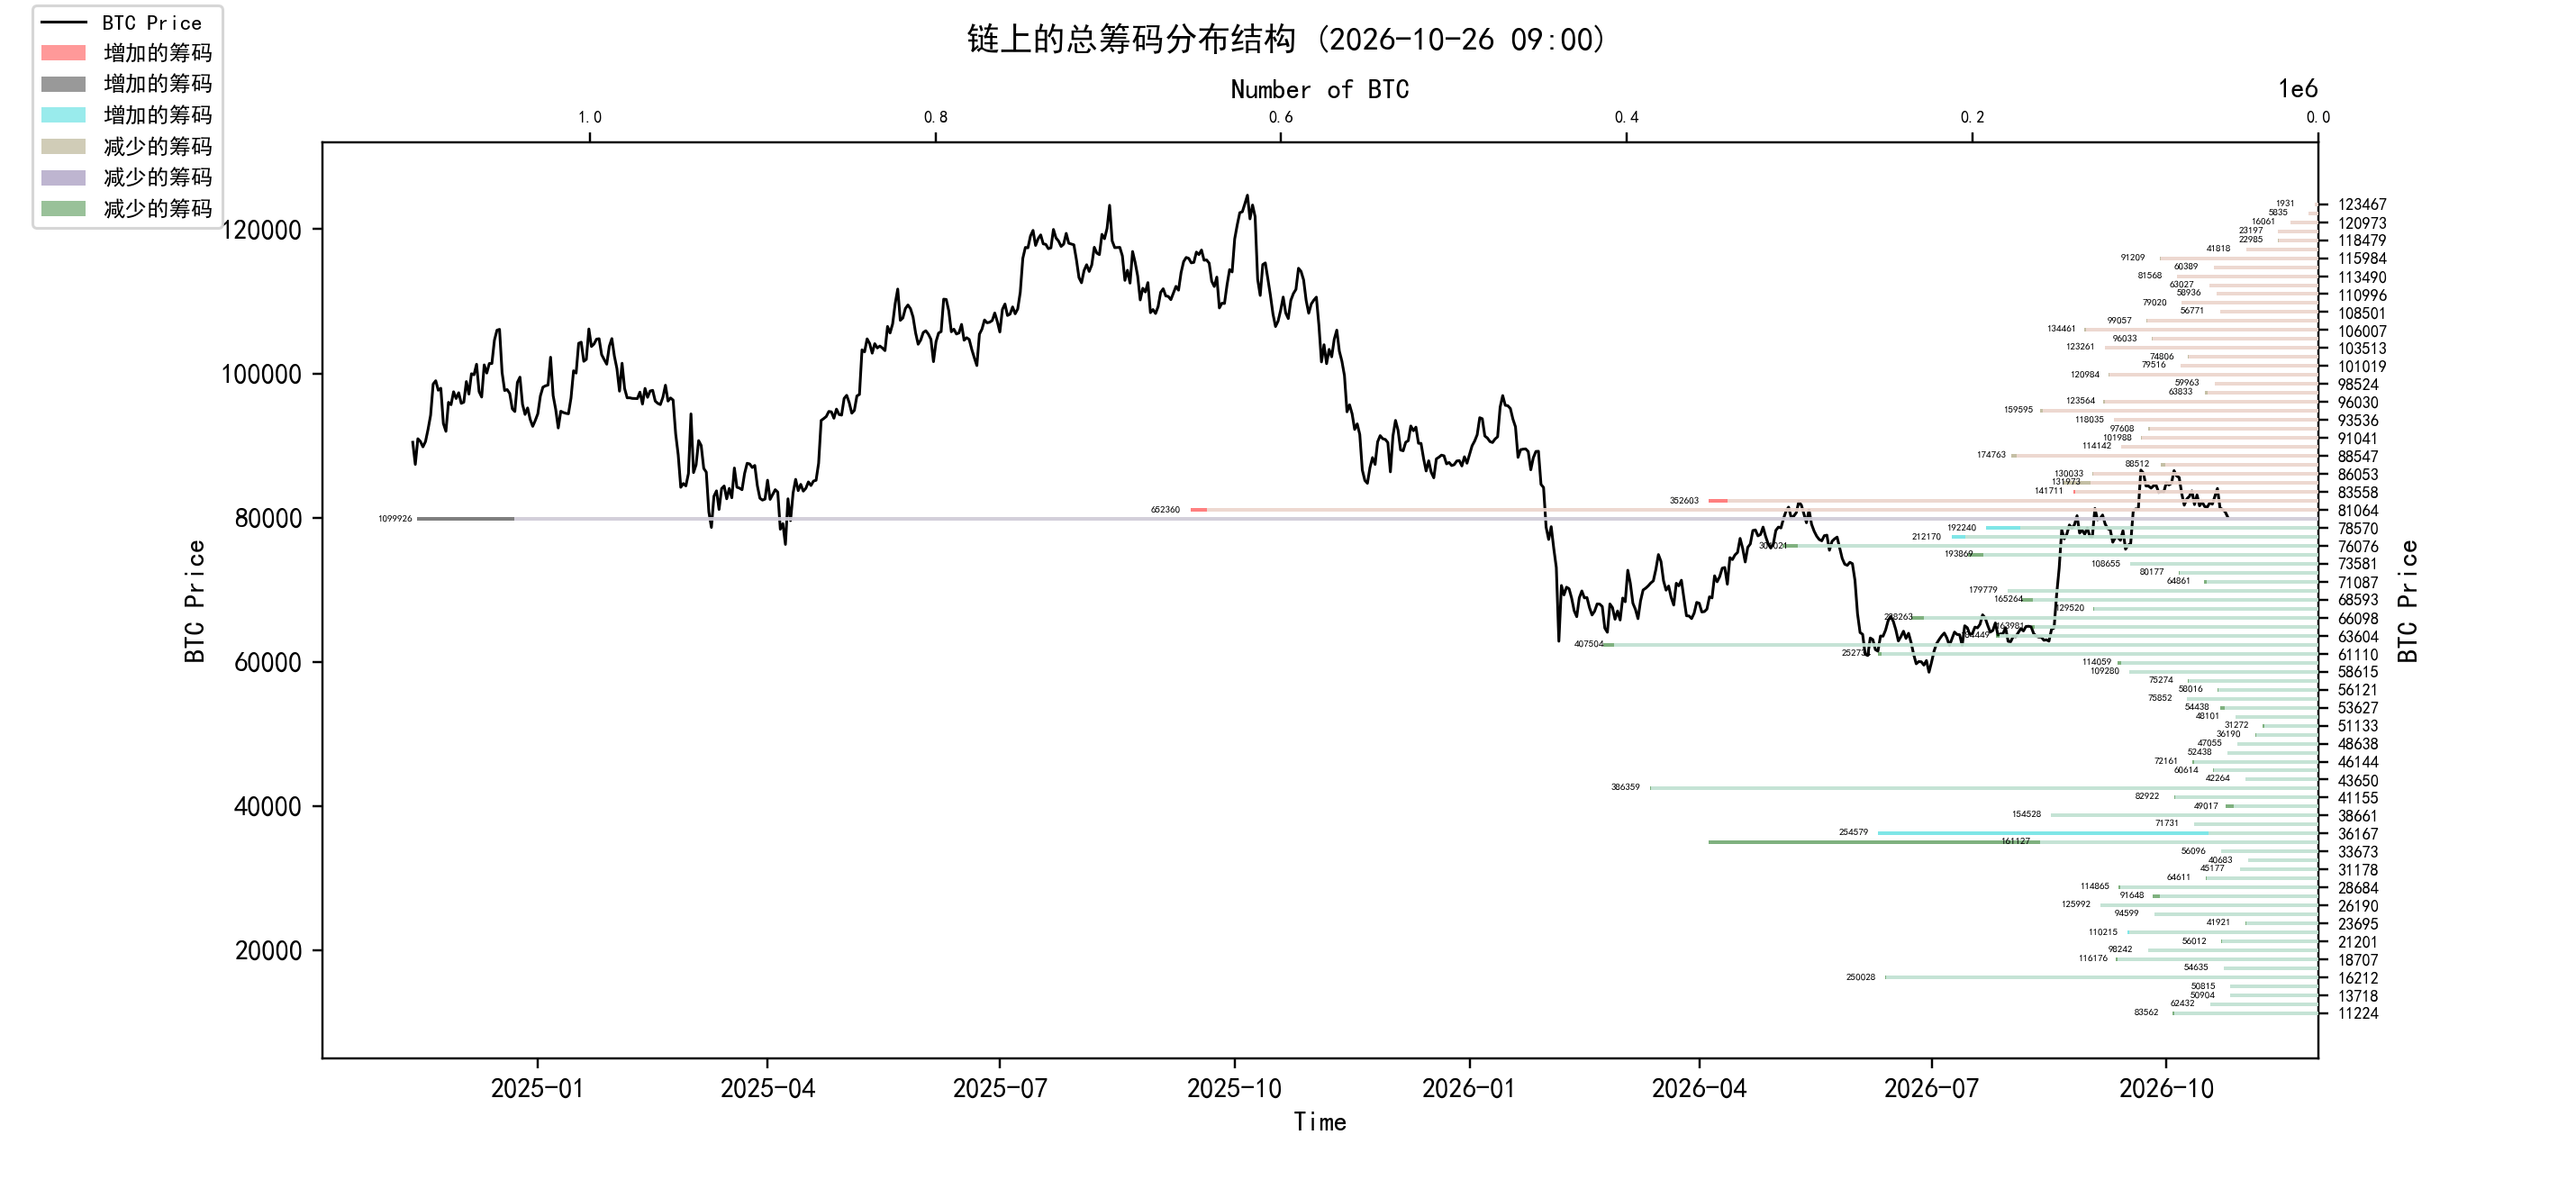
Analysis:
Around 1.54 million coins between $60,000 and $68,000;
Around 3.463 million coins between $76,000 and $89,000;
90,000–100,000: approximately 955,000 coins;
Above 100,000: approximately 1.21 million coins;
Weekly Briefing Section:
Long-Term Insight: Used to assess our long-term position—bull market, bear market, structural change, or neutral conditions
Medium-Term Assessment: Used to analyze the current market phase, how long it may last, and what conditions may arise
Short-Term Outlook: Used to analyze short-term market conditions, possible directional moves, and the likelihood of certain events under specific assumptions
Medium-Term Assessment
BTC Exchange Trend Net Position
Stablecoin Total Supply Net Position
Long- and Short-Term Supply Net Position
Realized Profit and Loss Net Position
(Chart below: BTC Exchange Trend Net Position)
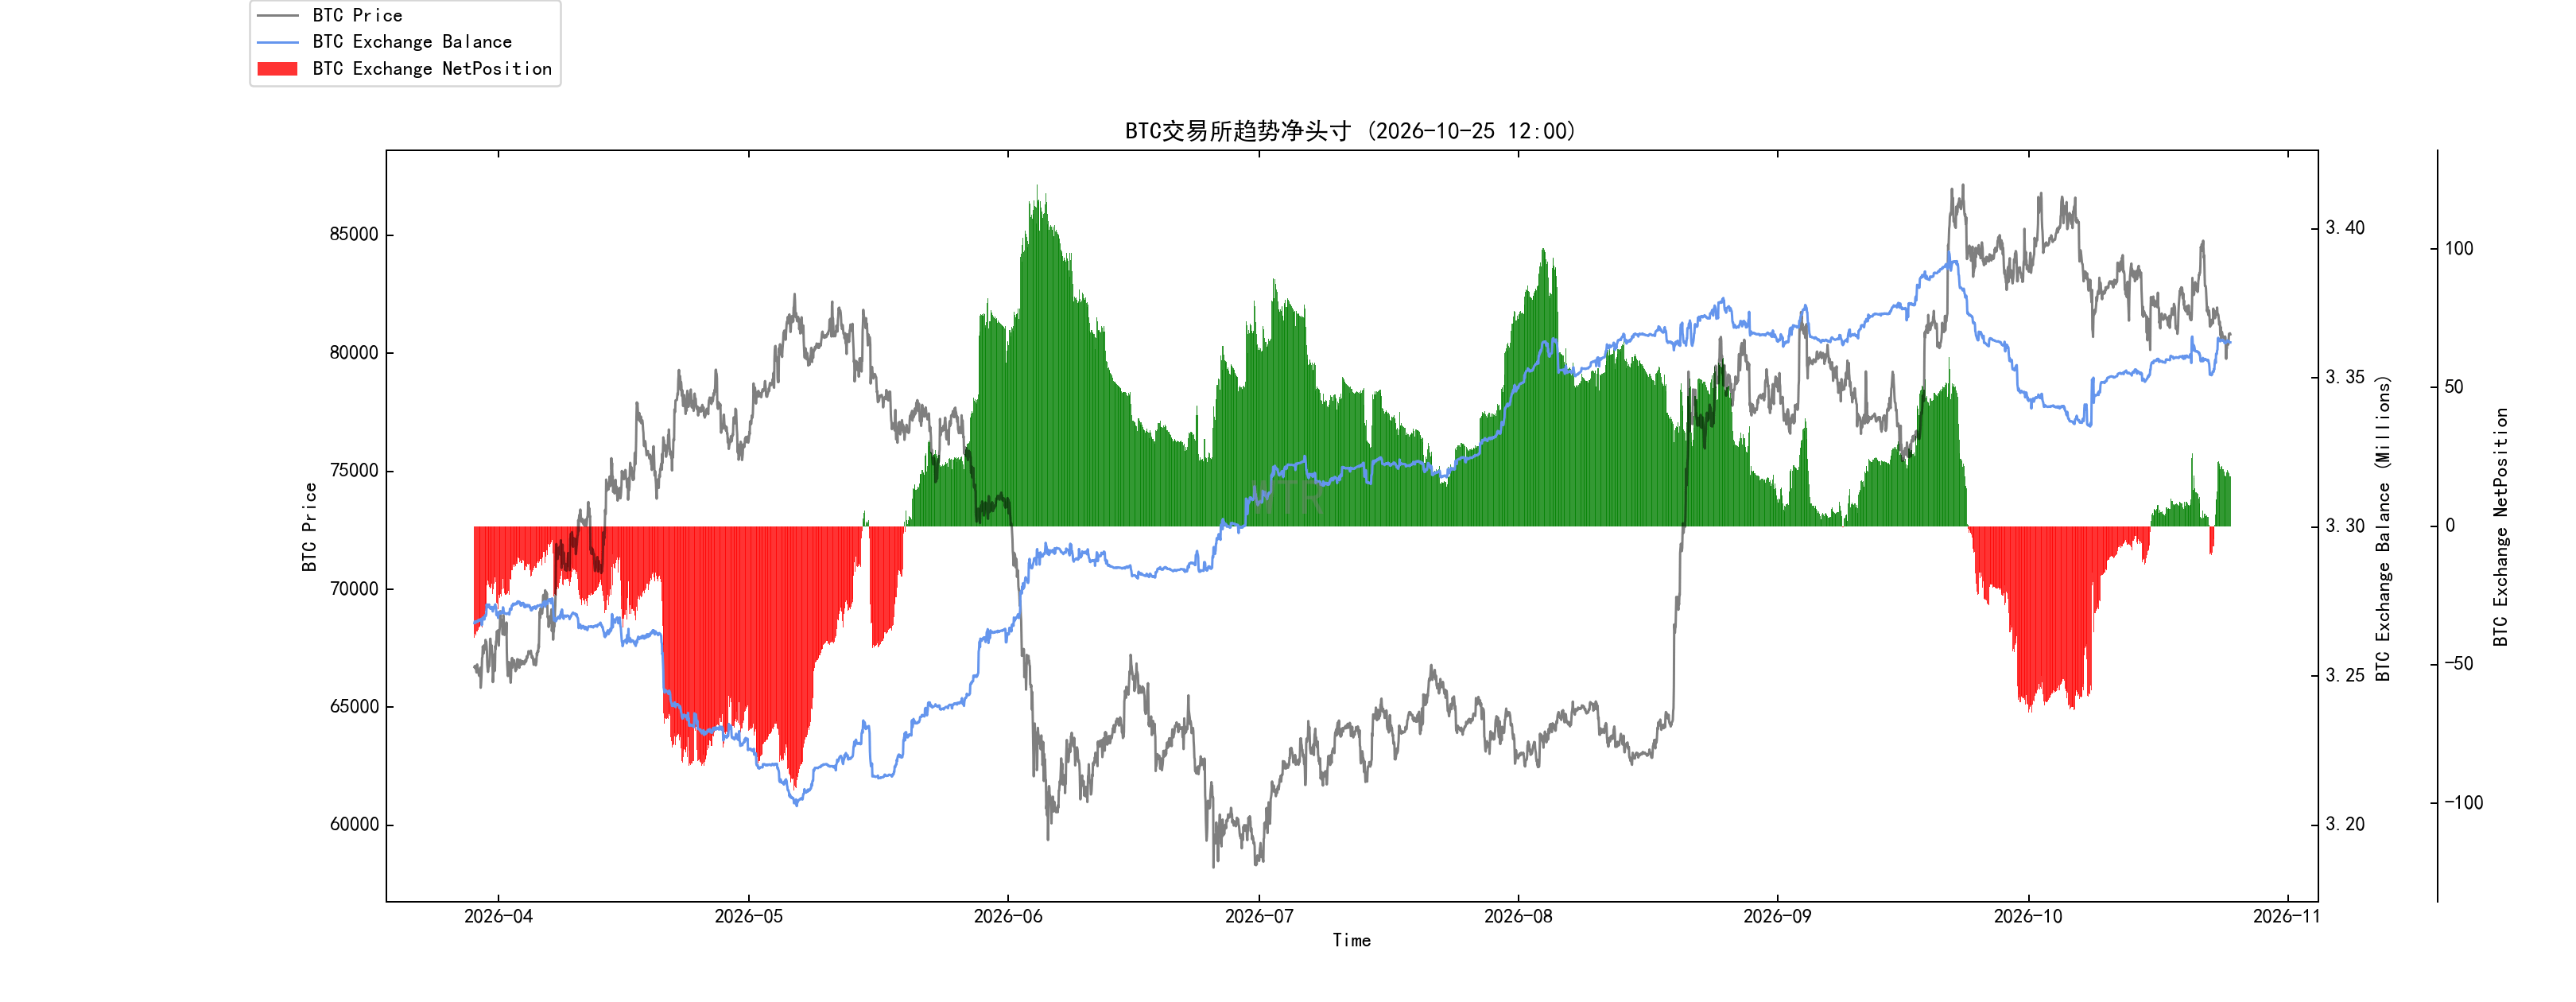
On-chain BTC exchange flow data shows that a small amount of potential sell-side supply continues to accumulate at exchange addresses, reflecting a cautious mindset among market participants, with concerns not yet fully dissipated.
This potential selling pressure has not yet been released all at once, and is currently acting as an implicit drag on the market.
(Chart below: Stablecoin Total Supply Net Position)
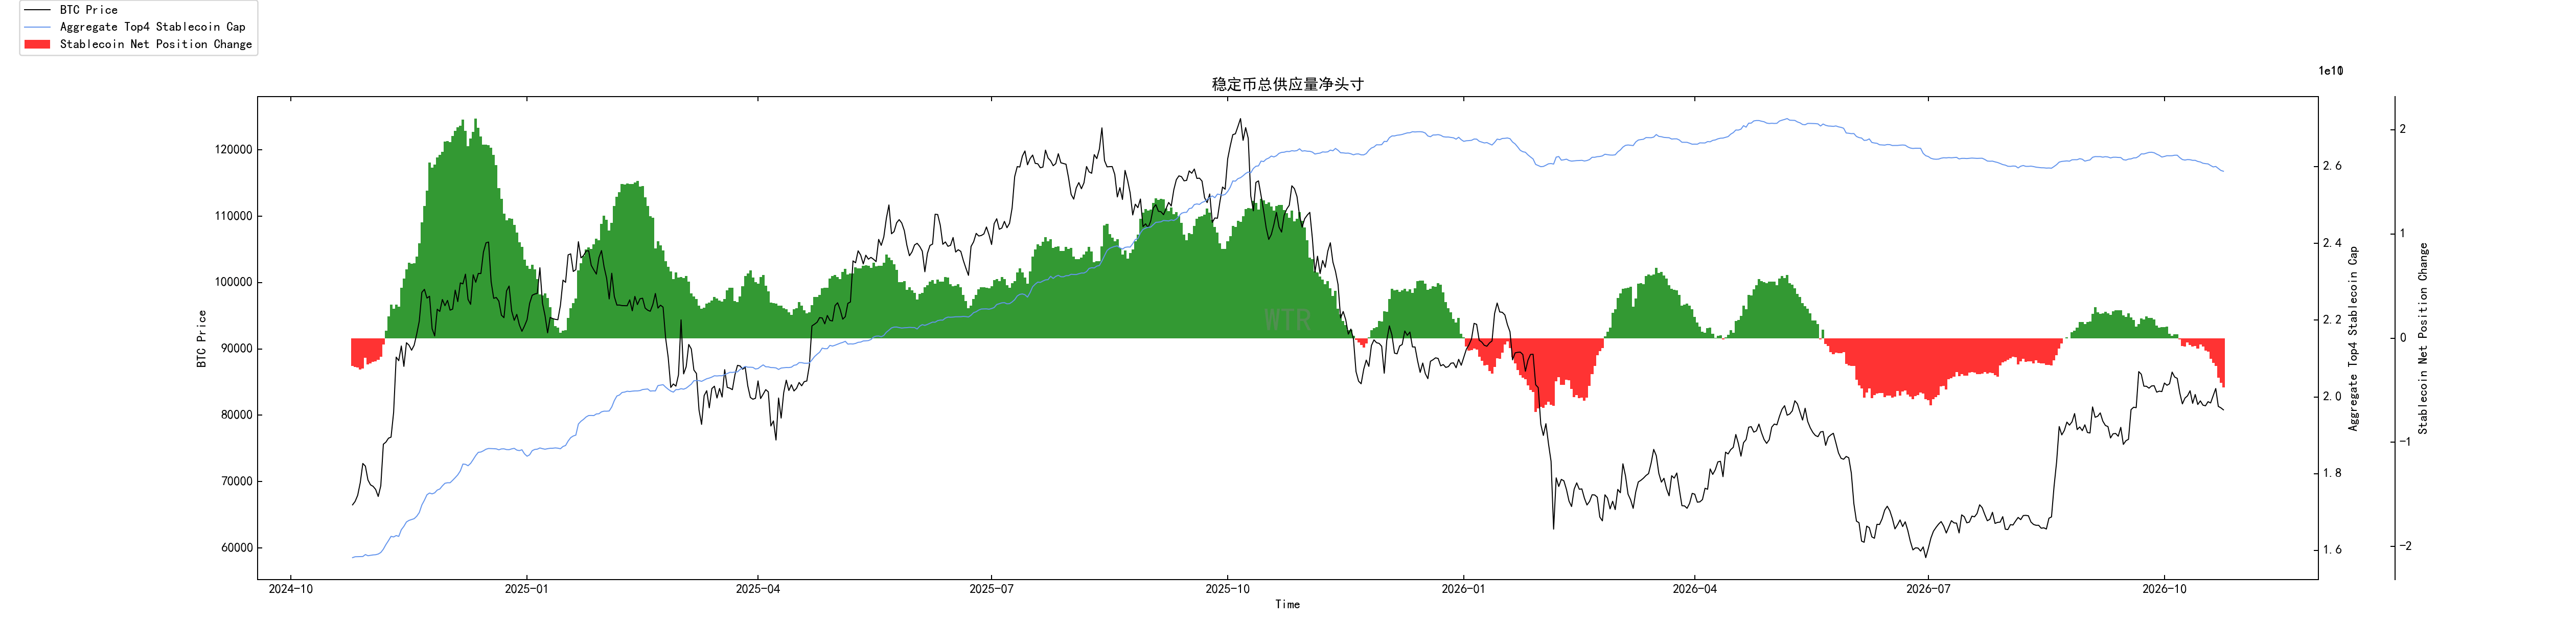
The stock of stablecoins is gradually declining, indirectly indicating a slight outflow of funds from the market.
There is insufficient inflow of new capital, while the existing pool continues to contract. Over the medium term, this poses a potential risk of tightening liquidity, which could limit further upside in the market.
(Chart below: Long- and Short-Term Supply Net Position)
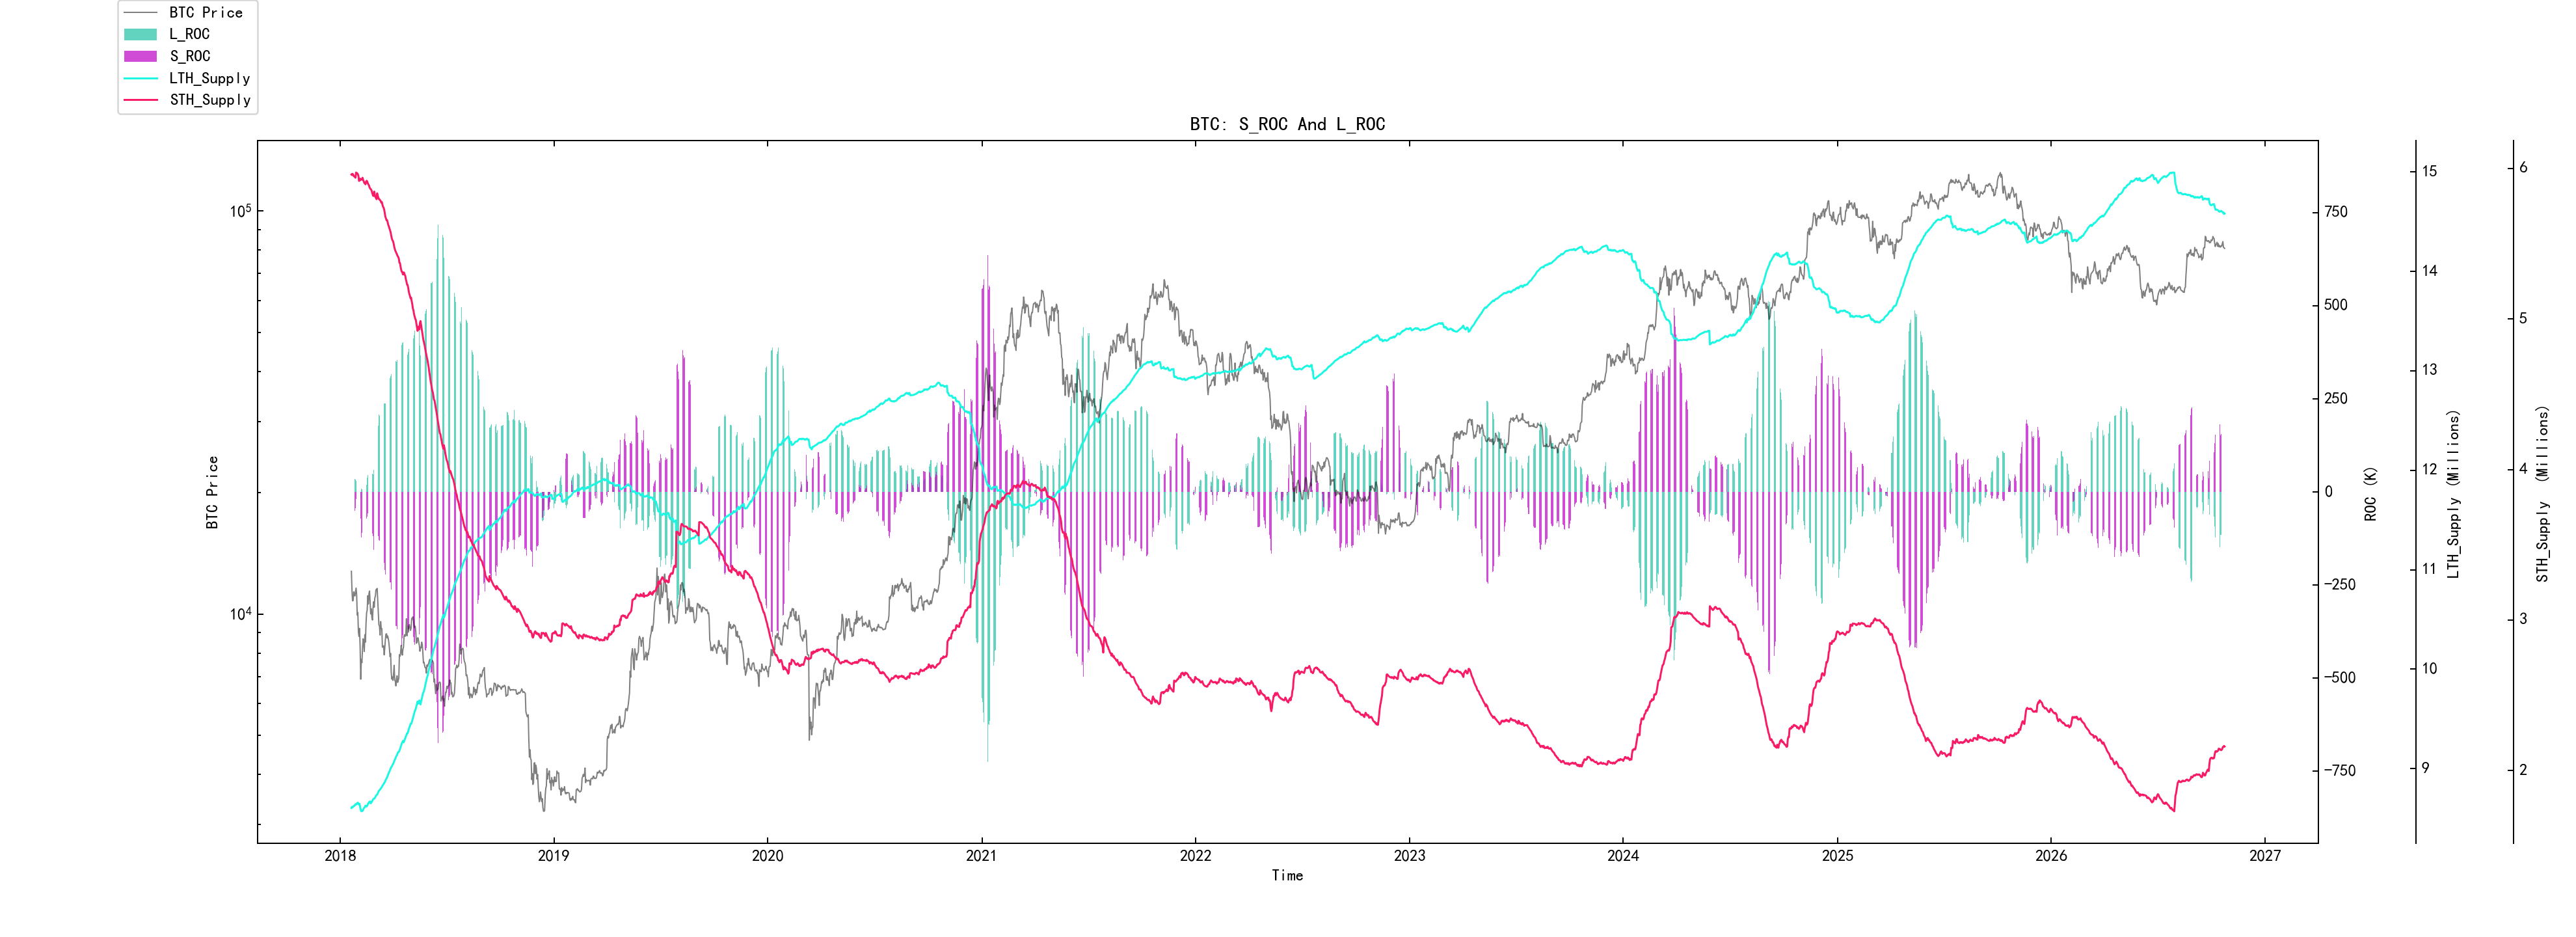
The market currently shows signs of divergence in capital flows:
Short-term capital is gradually entering and providing support, while long-term holders continue to distribute their holdings slowly—a pattern resembling a primary uptrend driven by new capital.
Market participants remain cautious overall, making the competitive landscape more complex; the trend direction should not be judged too simplistically.
(Chart below: Realized Profit and Loss Net Position)
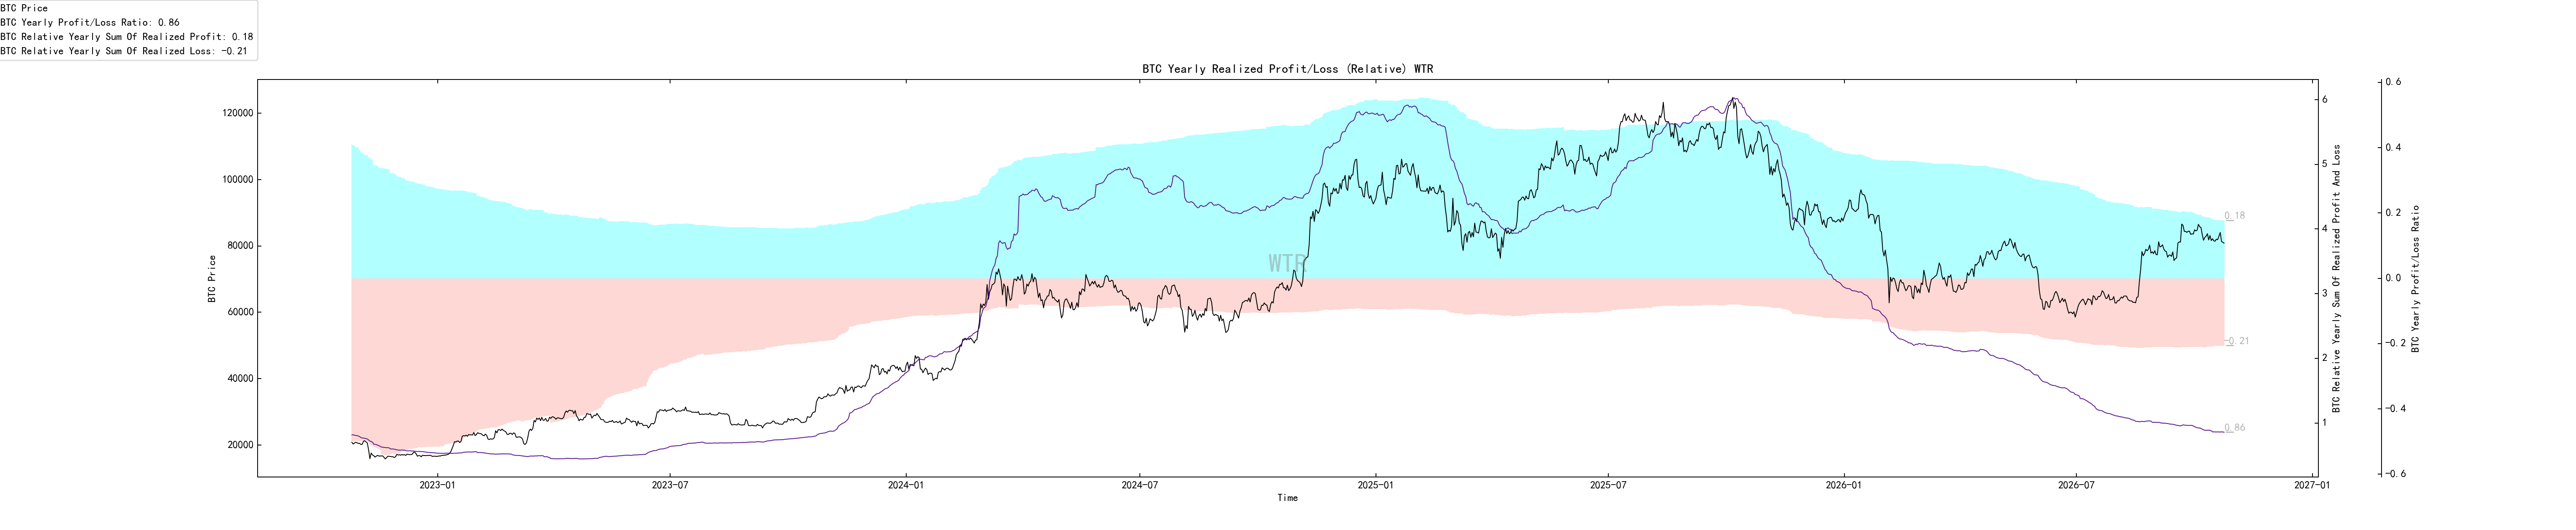
On-chain spending of coins at a profit or loss shows no significant increase in either profit-taking pressure or loss-driven selling. The annualized moving average of coin holdings remains stable, with no major fluctuations alongside the price structure.
A relatively positive sign is that selling by holders at a loss has eased, helping to keep the current price structure stable.
However, there has been little profit-taking, indirectly indicating a lack of buyers willing to step in and drive prices higher.
The market may need to rely on the accumulation of coins among participants to recover going forward.
Short-Term Outlook
Derivatives Risk Factor
Derivatives Trading Volume
Profit and Loss Transfer Volume
Cost Basis Lines for Long- and Short-Term Holders
Bitcoin Exchange Net Position
Ether Exchange Net Position
Derivatives Rating: The risk factor is in the green zone, indicating low derivatives risk.
(Chart below: Derivatives Risk Factor)
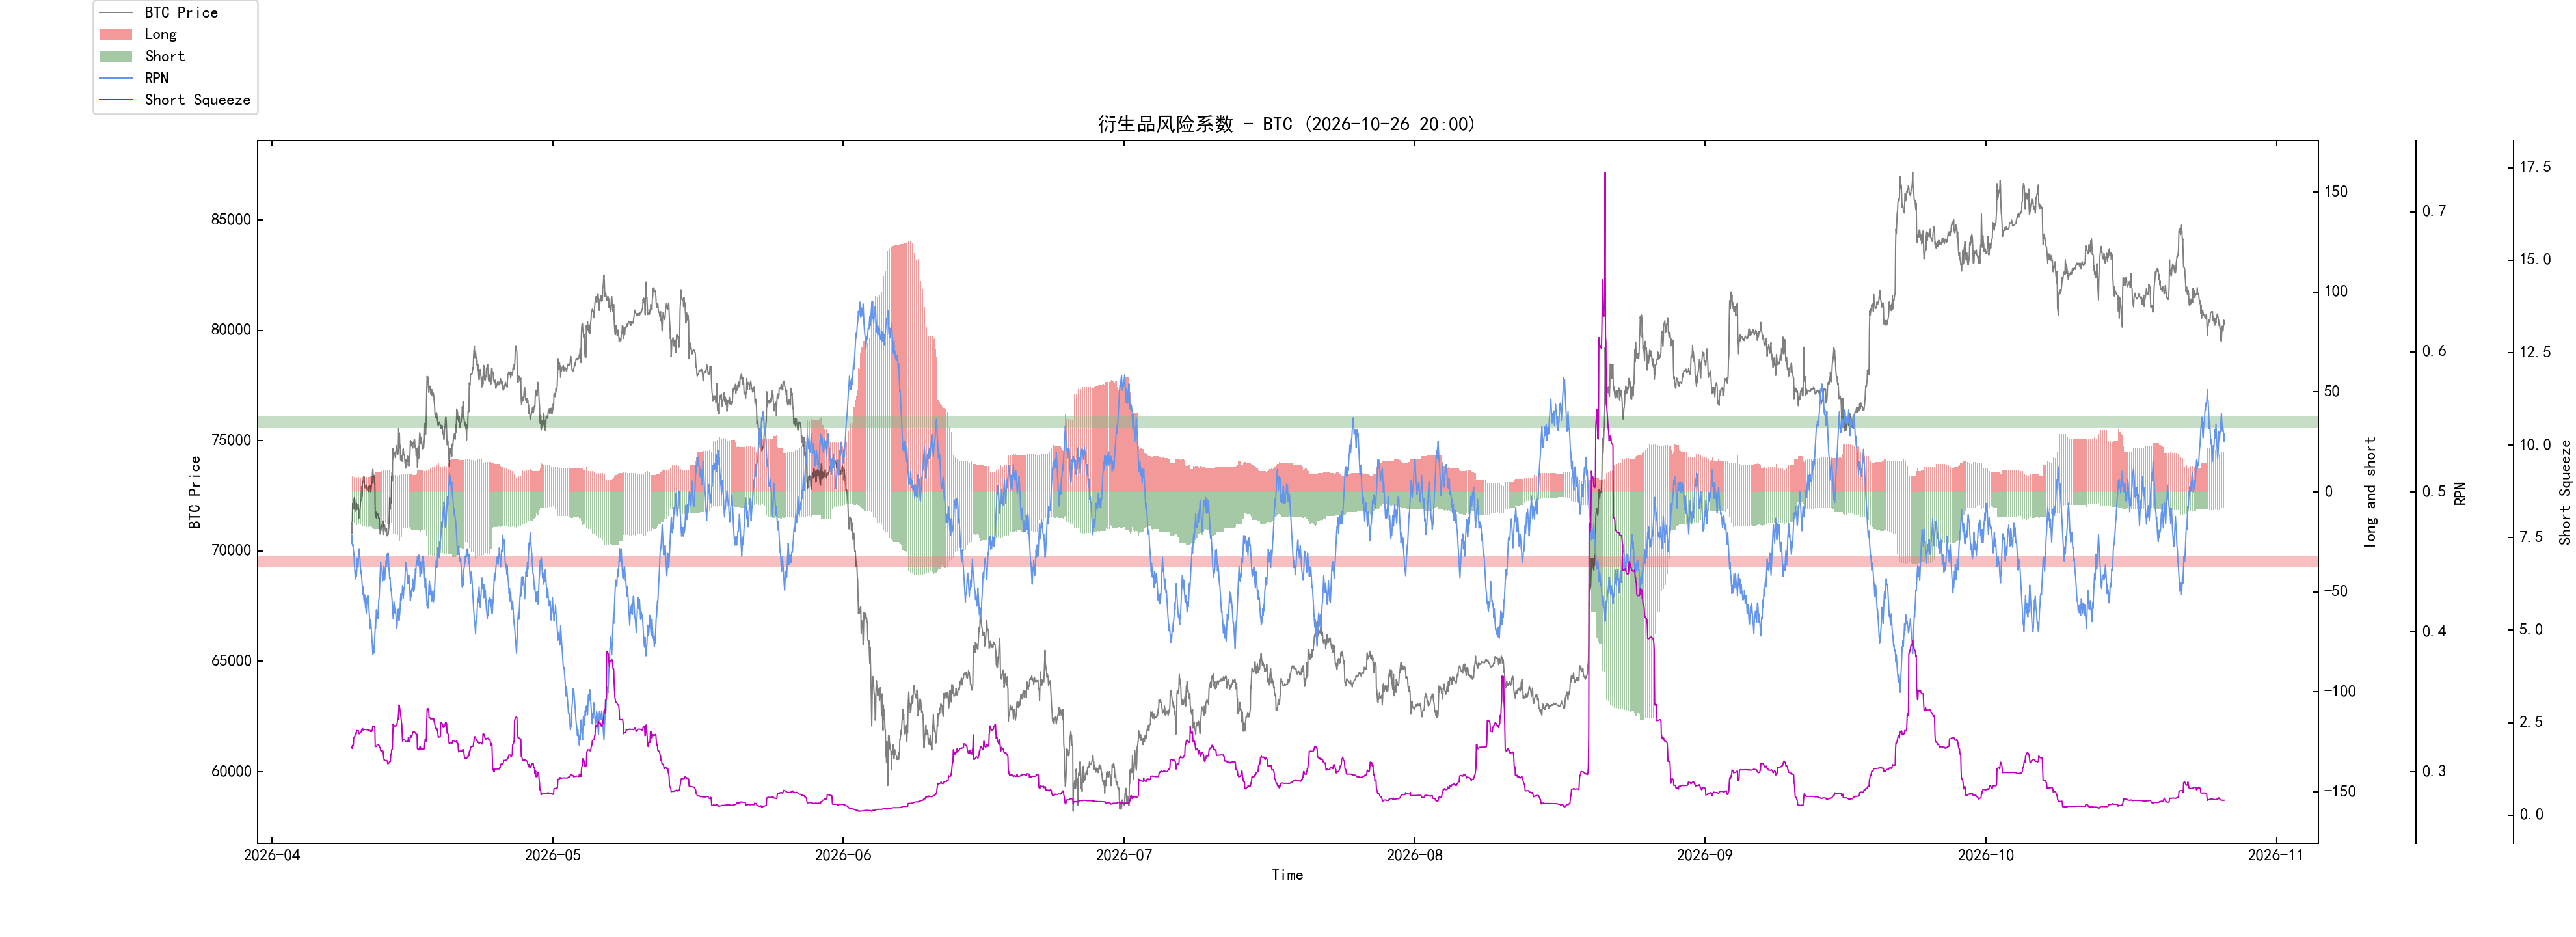
The risk factor is in the green zone. Derivatives continue to seek liquidity within the range, with no clear expectations at present.
(Chart below: Derivatives Trading Volume)
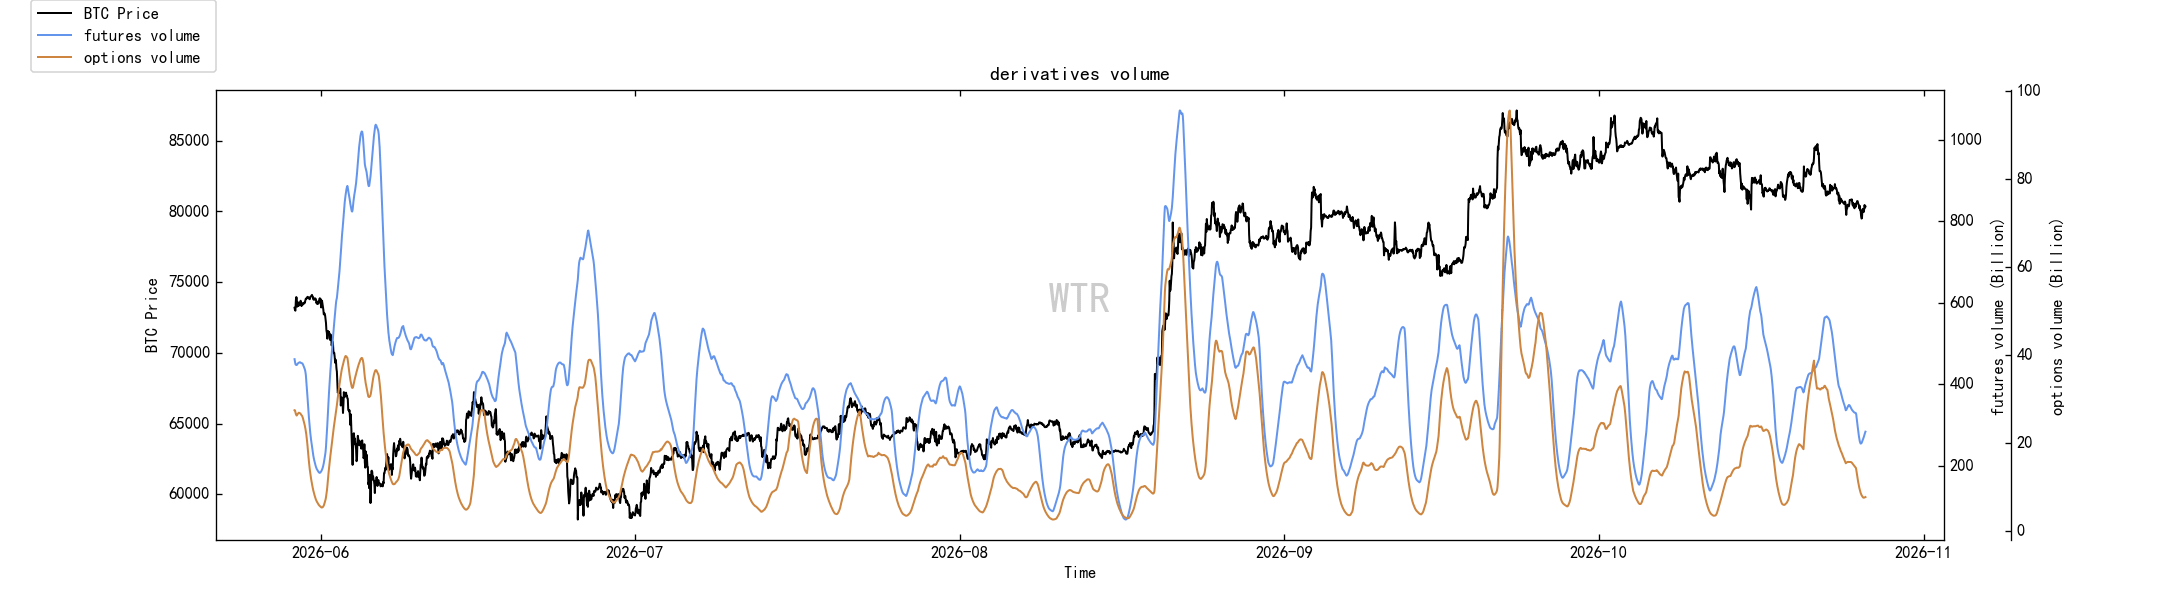
Derivatives trading volume is currently low.
Sentiment Rating: Neutral
(Chart below: Profit and Loss Transfer Volume)
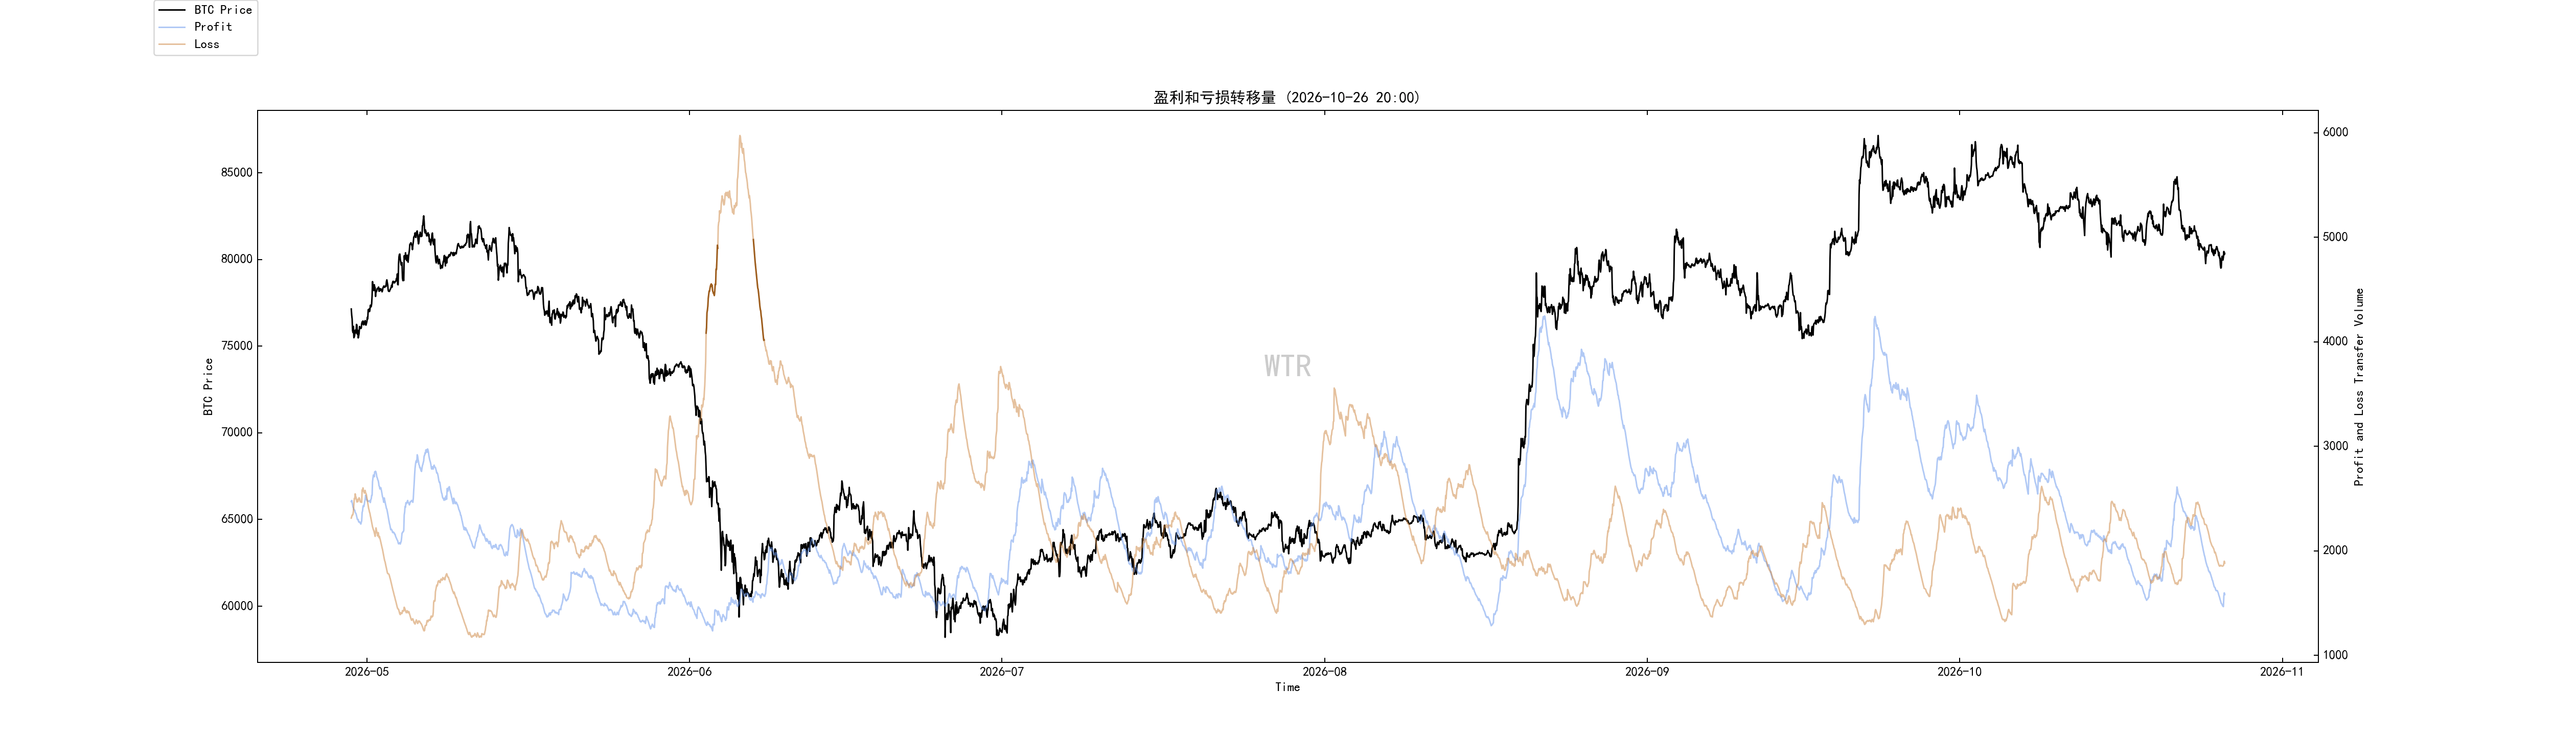
Market sentiment has cooled completely and is neutral. Patience is needed while waiting for the next price direction.
(Chart below: Cost Basis Lines for Long- and Short-Term Holders)
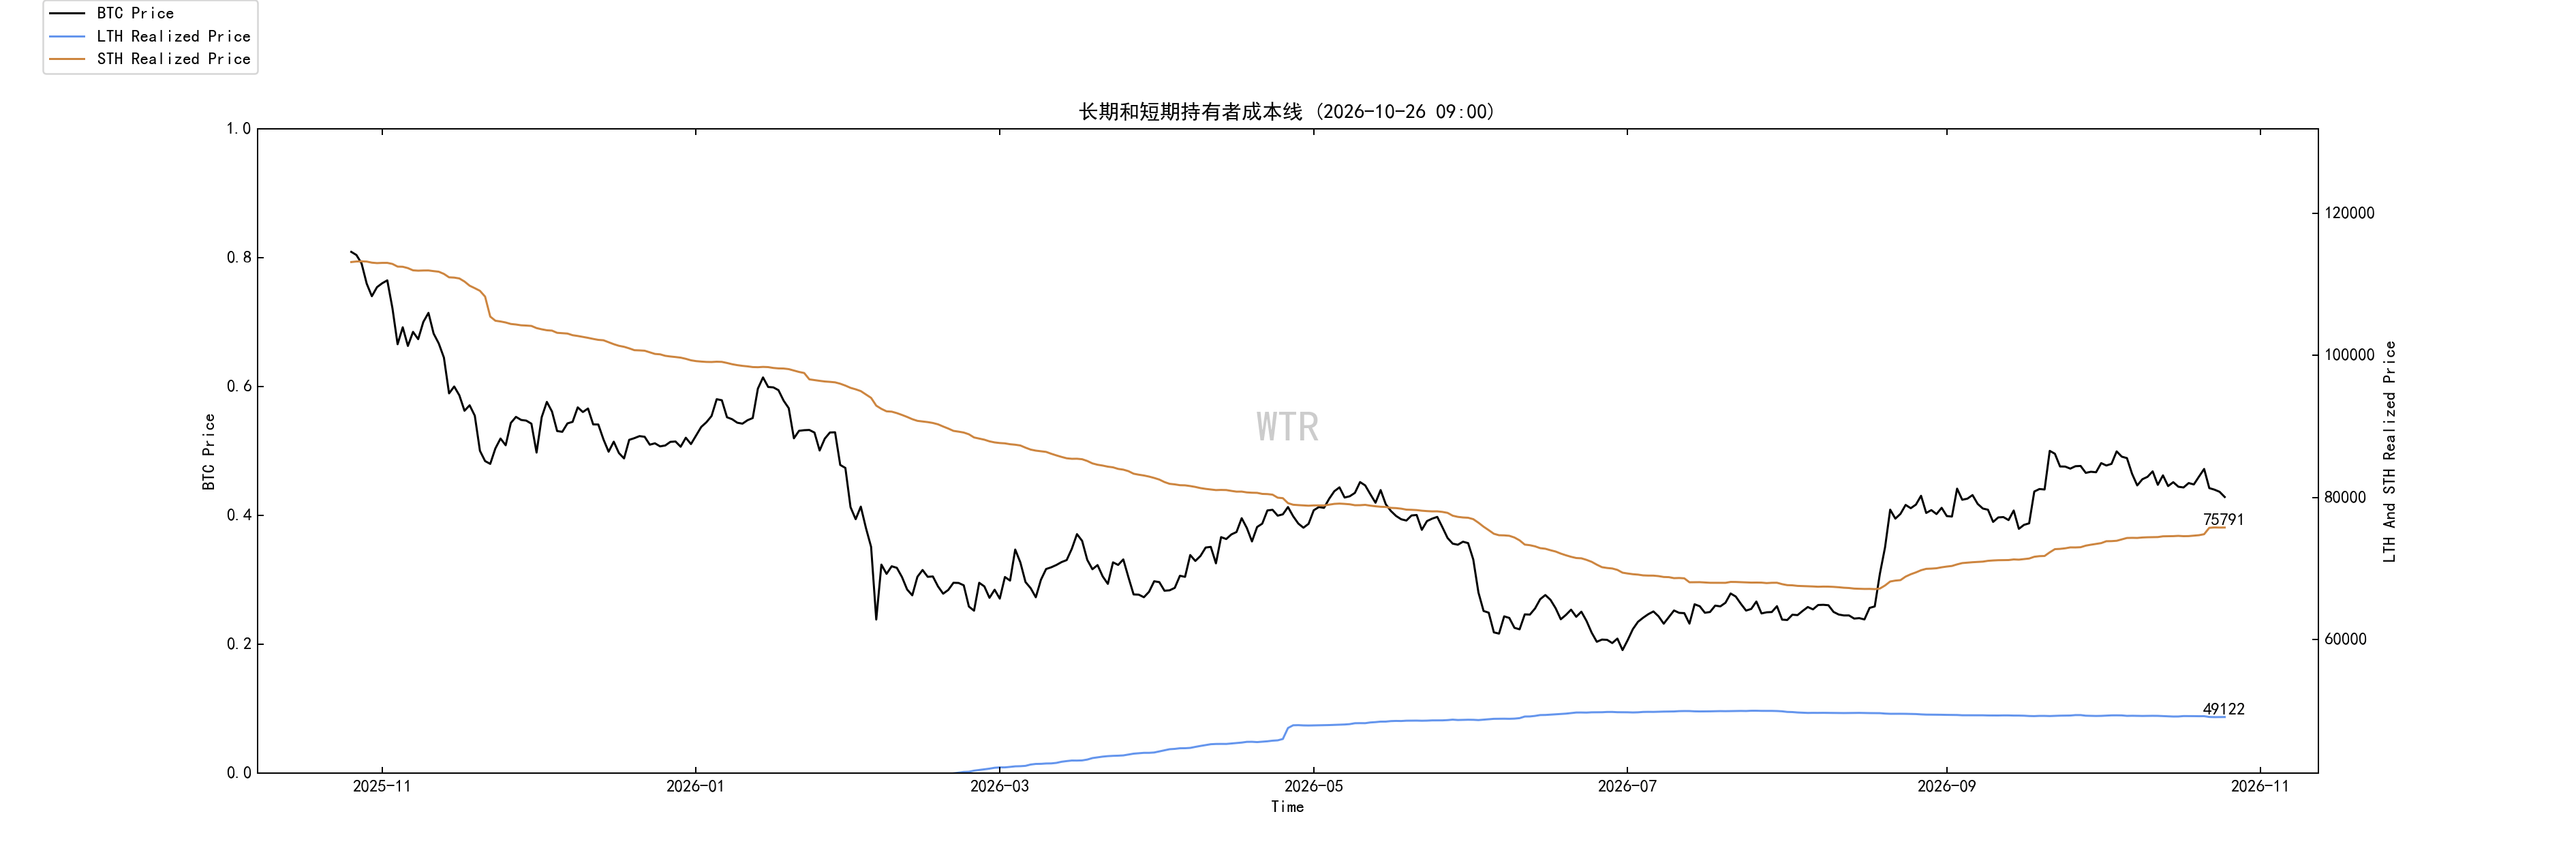
The short-term holder cost basis has risen to around $75,700, while the long-term holder cost basis is around $49,000.
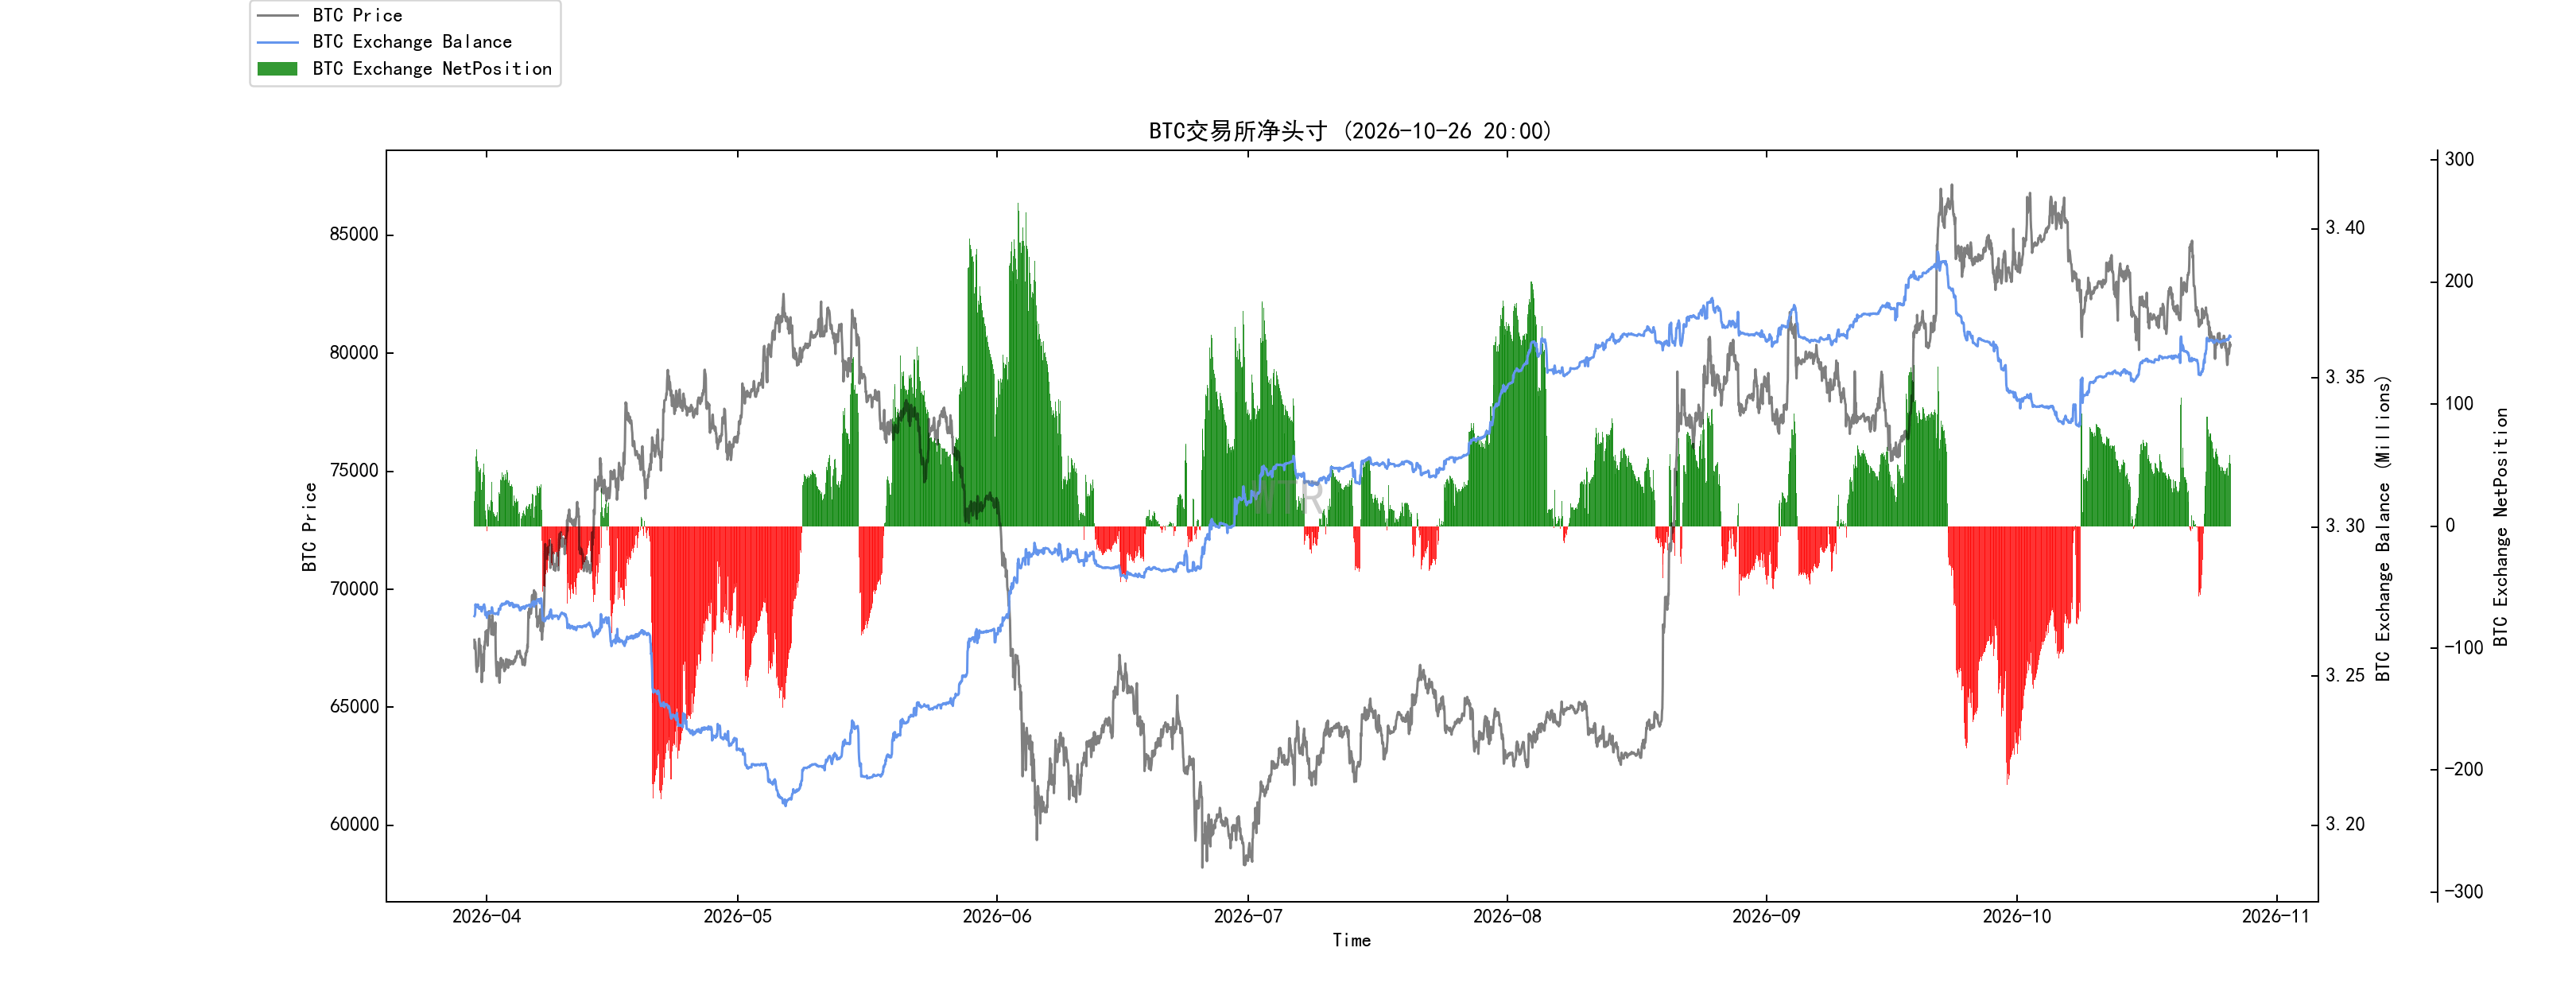
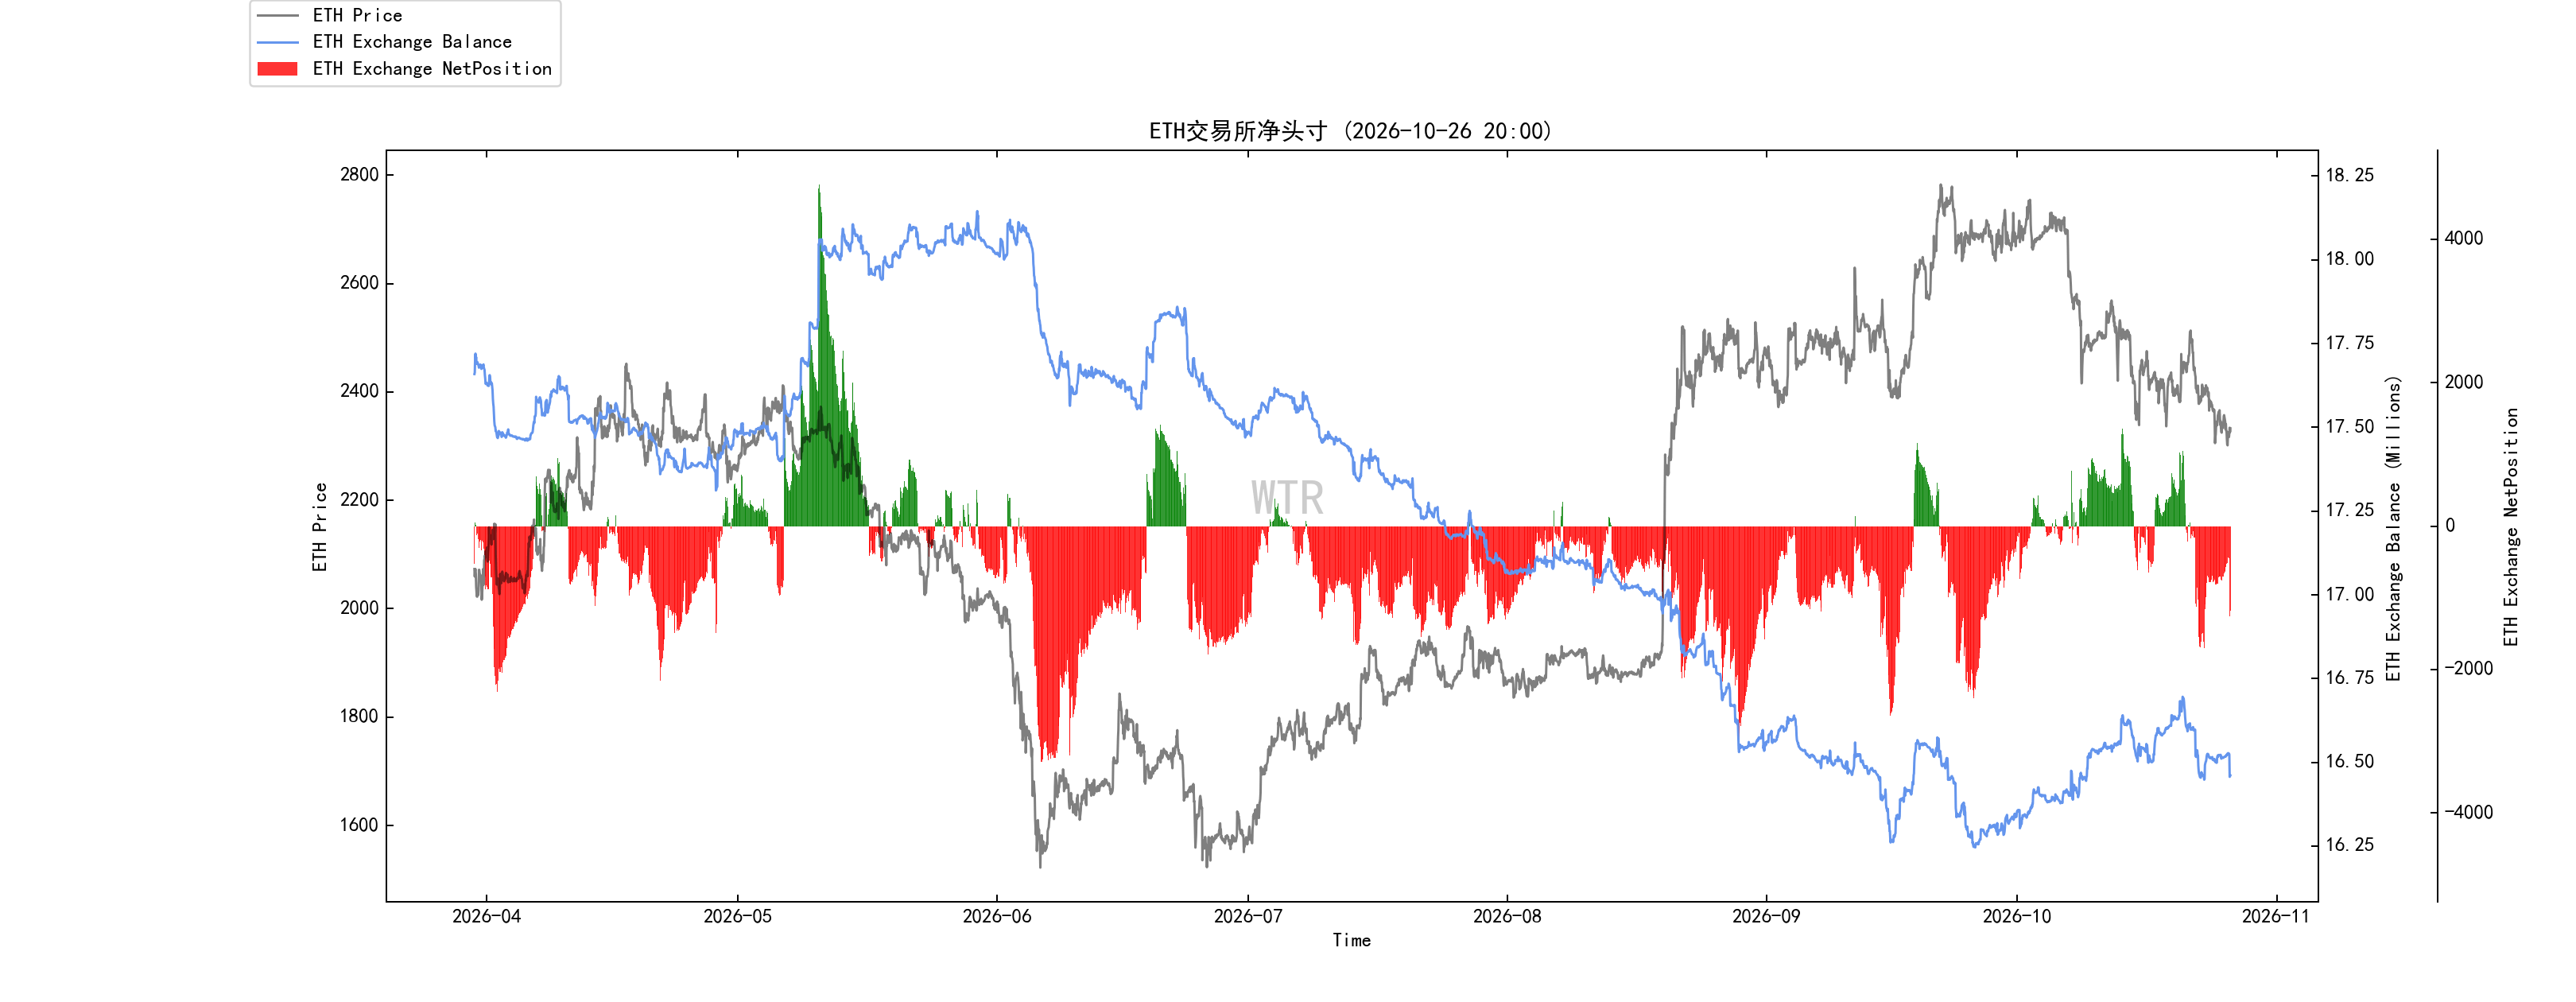
Spot and Selling Pressure Rating: BTC exchange net positions are in an overall state of inflow and accumulation, while ETH is seeing a slight outflow.
(Chart below: BTC and ETH Exchange Net Positions)
Weekly Summary:
Medium-Term On-Chain Assessment:
A small amount of supply is accumulating on exchanges, and market sentiment is cautious;
Stablecoin supply is declining, raising liquidity concerns;
Long- and short-term capital flows are diverging, making market dynamics complex;
Selling pressure is broadly stable, but upward momentum remains insufficient.
Market Outlook:
Stalemate and divergence
Capital flows are diverging and bulls and bears are at an impasse; wait for coin accumulation and increased buying power to improve conditions
Short-Term On-Chain Outlook:
Derivatives Rating: The risk factor is in the green zone, indicating low derivatives risk.
Sentiment Rating: Neutral.
Market Outlook:
Market sentiment is neutral. There are no particular expectations for this week; wait patiently for the market to show its direction. If the price reaches the short-term holder cost basis (a strong short-term support level), that would present another opportunity to build a position.
Risk Disclaimer:
The above is for market discussion and exploration only and does not constitute investment advice. Please exercise caution and guard against black swan risks in the market.
This report is provided by the “WTR” Research Institute.
Follow us!