Tesla’s gross profit rose by $440 million in the third quarter, while operating profit fell by $906 million. The extra gross profit was completely wiped out by the additional spending.
That’s the key point in this #特斯拉财报 —not revenue.
Revenue was $28.046 billion, versus $28.095 billion in the same quarter last year. It barely grew at all year over year.
The gross margin recovered from 18.0% to 19.6%. The car-selling part of the business is actually improving.
But R&D expenses climbed from $1.630 billion to $2.761 billion—an extra $1.131 billion in a year, up 69%.
Selling, general and administrative expenses rose from $1.562 billion to $2.015 billion, up 29%.
Operating expenses were up by a total of $1.346 billion, while gross profit increased by just $440 million.
The math is that simple. Operating profit was $718 million, down 55.8% from $1.624 billion in the same quarter last year.
That works out to $0.22 per share, versus $0.39 last year.
Gross margin recovered, but revenue didn’t grow. With the same margin applied to flatter revenue, gross profit can’t rise much in absolute terms.
The first nine months make the picture even clearer. Revenue was $78.669 billion, up 12.5% from last year.
Gross profit increased by $2.880 billion, but operating profit fell by $889 million. An extra $3.769 billion was spent in between.
The cash flow line is even more straightforward. Operating cash flow was $14.897 billion, versus $10.934 billion last year.
Capital expenditures more than doubled, rising from $6.134 billion to $13.014 billion.
After capital expenditures, free cash flow was $1.883 billion, down 60.8% from $4.800 billion in the same period last year.
Net income for the first nine months was $2.378 billion, down 19.5% from $2.954 billion last year.
They’re selling more, earning less, and spending much more aggressively.
The summary doesn’t make clear what drove the gross margin improvement. Were material costs lower, or did capacity utilization improve? Those two explanations have completely different implications for next year.
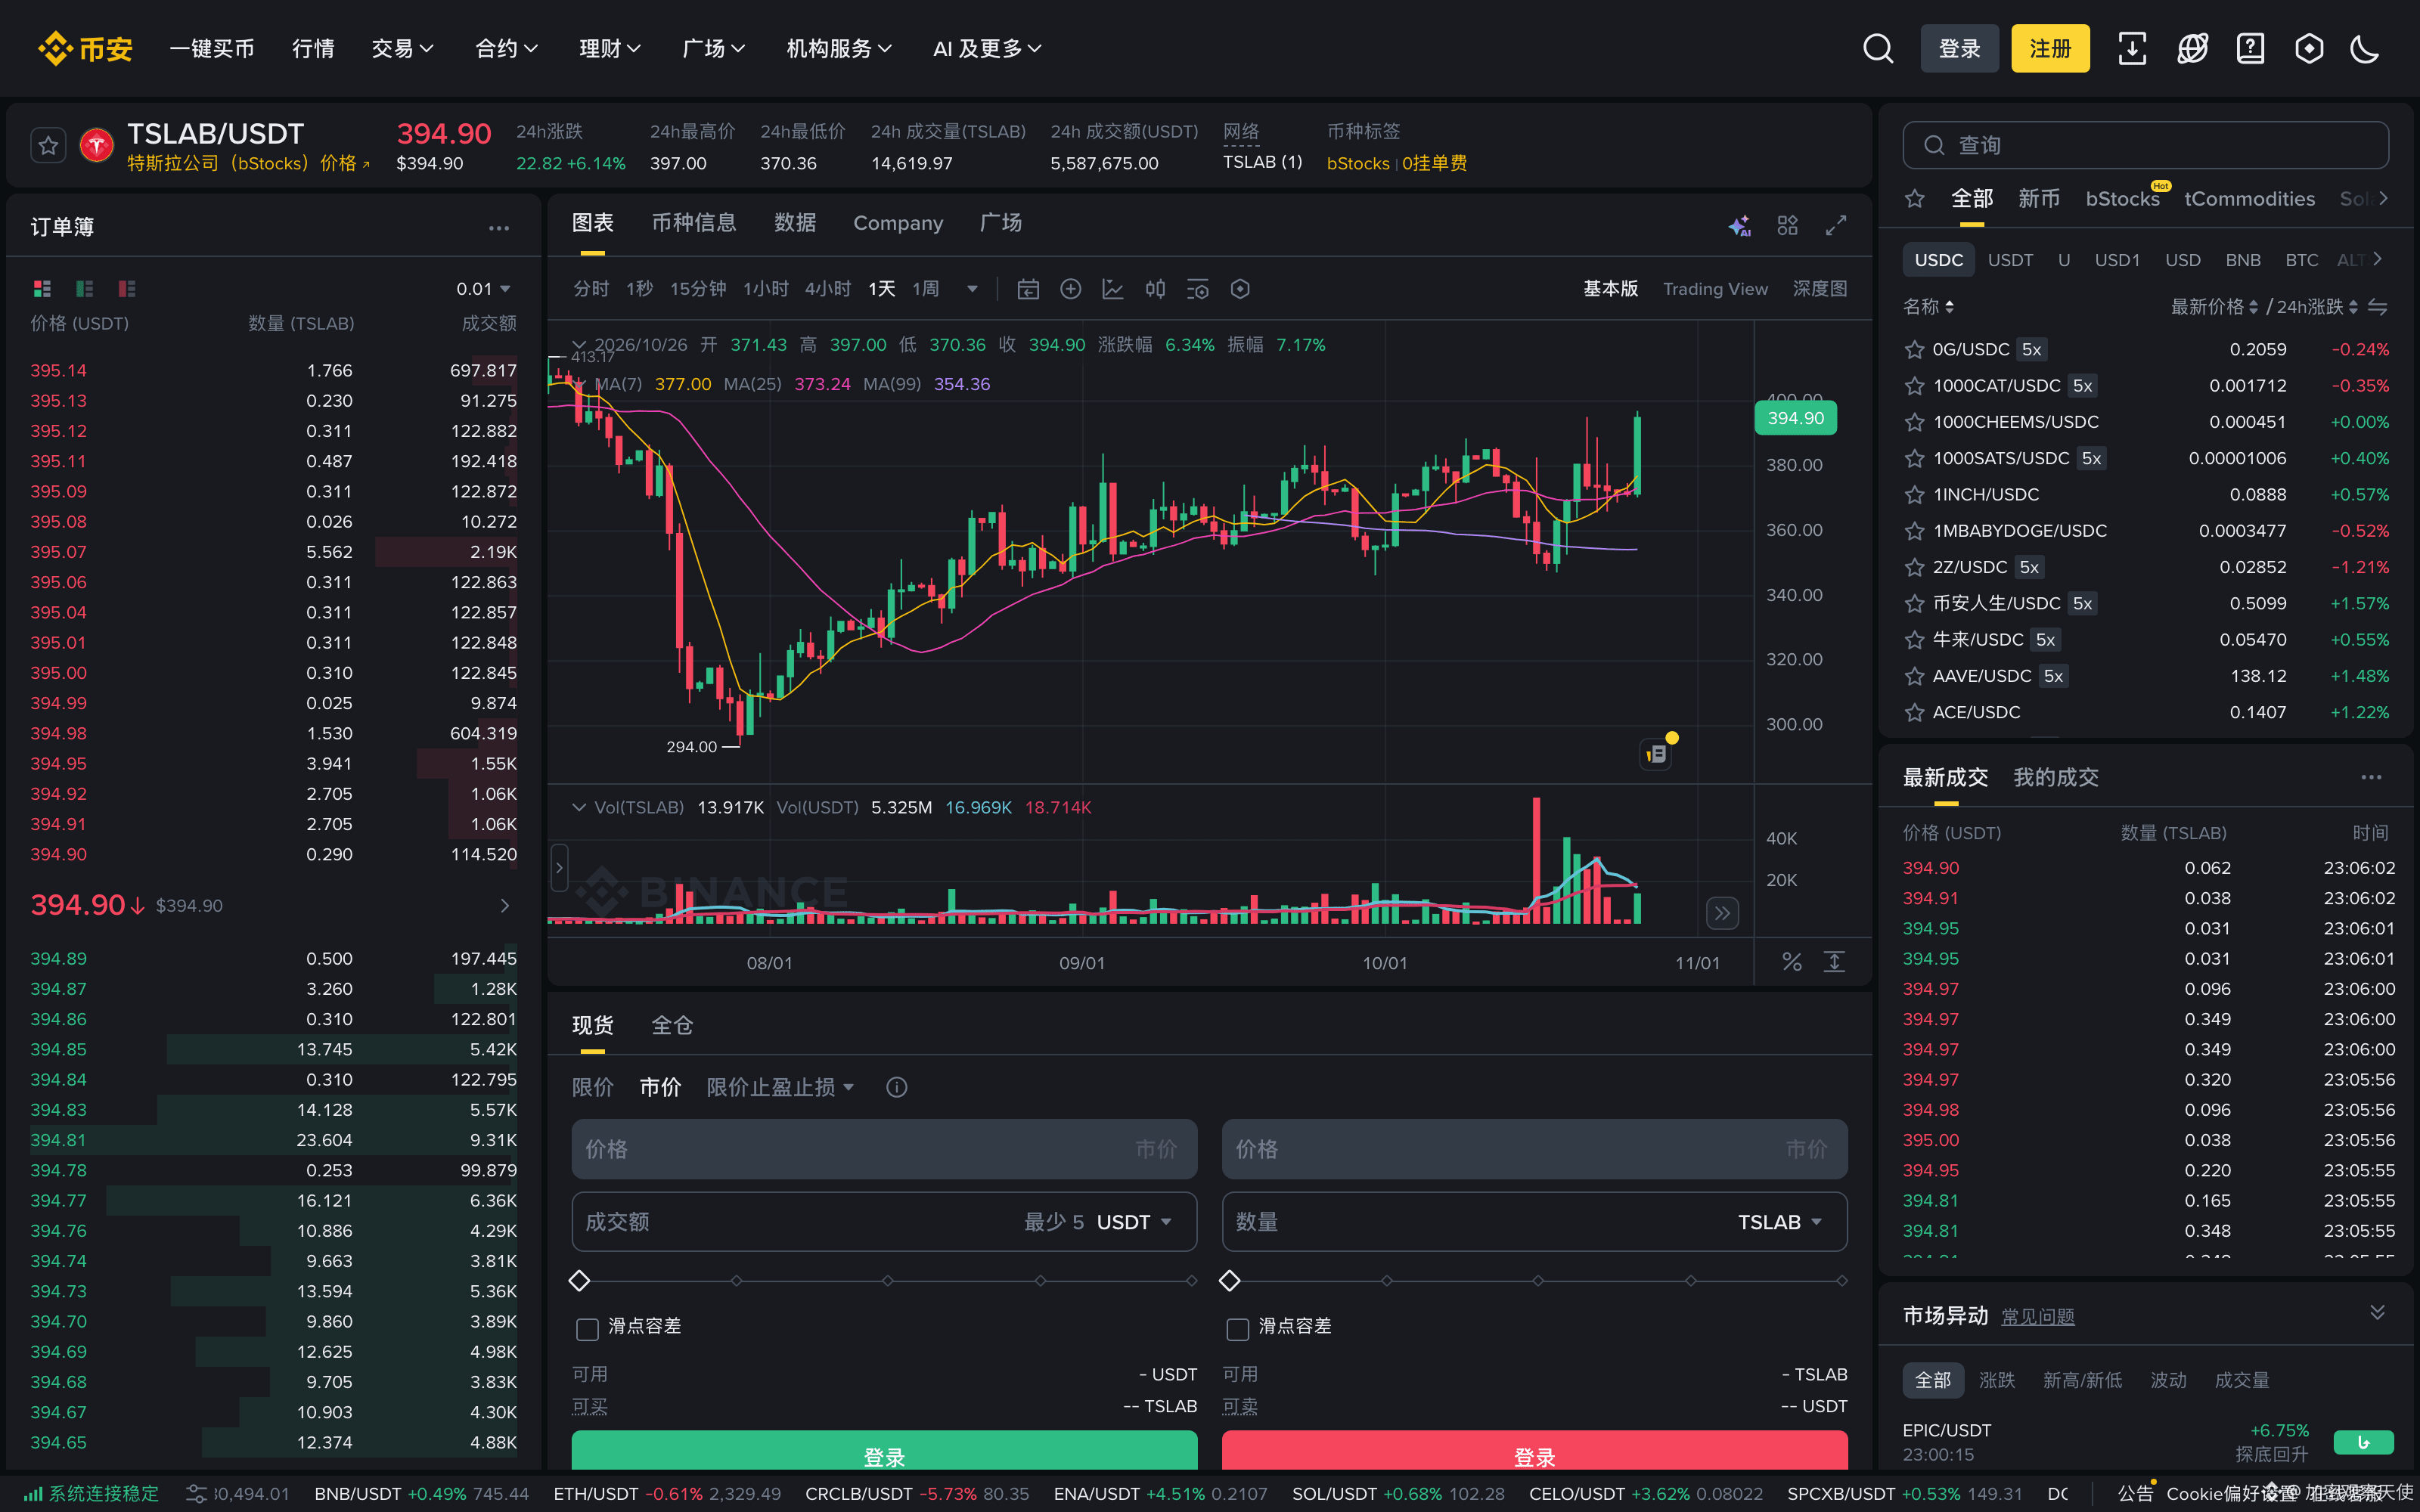
$TSLAB is this stock’s price exposure on Binance. On the day of the earnings report, it hit a high of 395.11 and closed at 373.94.
The next four daily candles closed at 373.82, 372.50, 372.06, and 371.34, grinding steadily lower.
Then today, after the U.S. market opened, it reversed course and is now at 394.90.
24-hour trading volume is $5.58 million, compared with less than $510,000 for all of last Saturday.
It has reclaimed all three moving averages: the 7-day at 377.00, the 25-day at 373.24, and the 99-day at 354.36.
The down day on the earnings report was erased in a single day.
At an annualized rate based on this quarter, earnings per share are below $0.90. At this price, that implies a P/E ratio of more than 400.
What I can’t pin down is which area accounted for the extra $1.131 billion in R&D spending. Was it AI training, or new vehicle and battery development? The earnings summary doesn’t break it out. It’s plausible, but impossible to verify.
The structure is what’s really worth remembering.
Any earnings report that tells a story based on gross margin ultimately has to answer for itself on the operating profit line.
Because gross profit is about the product; profit is about the company.
The earnings were ugly, yet the price returned to its pre-report level in a single day. The market isn’t buying this quarter’s profits.
When a company’s gross margin is recovering and its R&D spending is surging, do you value it as an automaker or as an AI company?
Earnings data from SEC EDGAR Form 10-Q (filed 10/22); prices are a 23:06 CST snapshot.
This is an earnings breakdown, not investment advice.