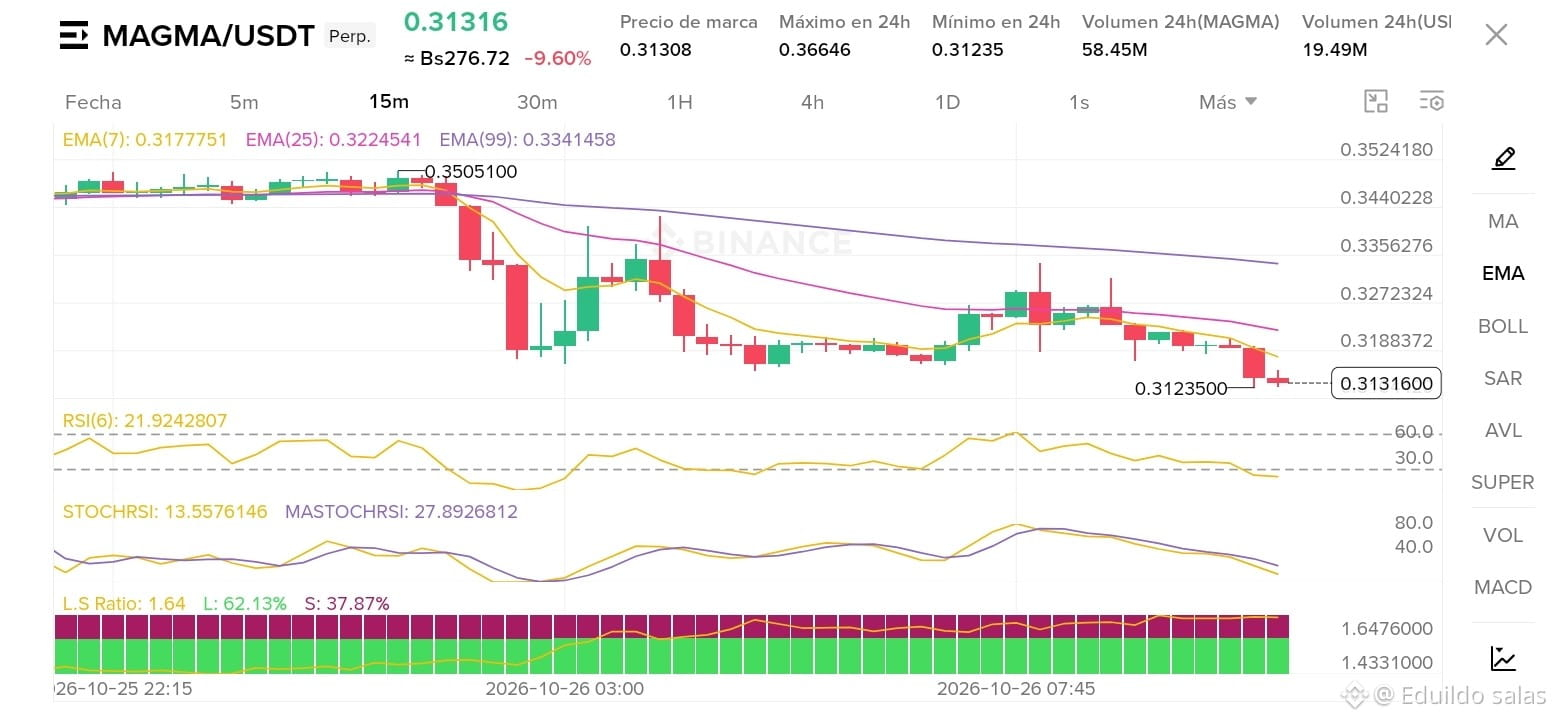
🚀 Opportunity in $MAGMA /USDT! Accumulation zone or bearish trap? 📉🔥
The $MAGMA /USDT pair is showing a -9.60% correction on the 15-minute chart, currently trading at 0.31316 USDT. After a rejection in the resistance zone near 0.35051 USDT, the price has been gradually pulling back.
However, there are key signals that smart traders are closely watching:
Oversold indicators: RSI(6) is at extremely low levels (21.92), indicating that selling pressure has been exhausted in the short term.
StochRSI: Located in the lower zone (13.55), suggesting a possible imminent bullish cross for a technical relief bounce.
Price action: Immediate support is drawn around 0.31235 USDT. If buyers defend this zone, we could see a quick recovery impulse toward the moving averages (EMA).
Are you waiting for a breakout confirmation or looking to buy this dip? Let me know in the comments! 👇💬
📊 Trading Strategy (Limit Order)
To trade this scenario with risk management, we propose the following structure in Futures/Spot:
Order type: Limit (Limit Order)
Entry Price (Buy/Long): 0.31250 USDT (aiming to take advantage of the current support)
Take Profit (TP):
TP1: 0.32250 USDT (close to the 25 EMA)
TP2: 0.33400 USDT (close to the 99 EMA)
Stop Loss (SL): 0.30750 USDT (protecting capital against a support invalidation)
⚠️ Remember to use proper risk management and adjust leverage according to your risk tolerance.
#MAGMAUSDT #BinanceSquare #EarningsSeason #BinancePick #StrategyMSTRSurpassesNasdaqInMarketCap