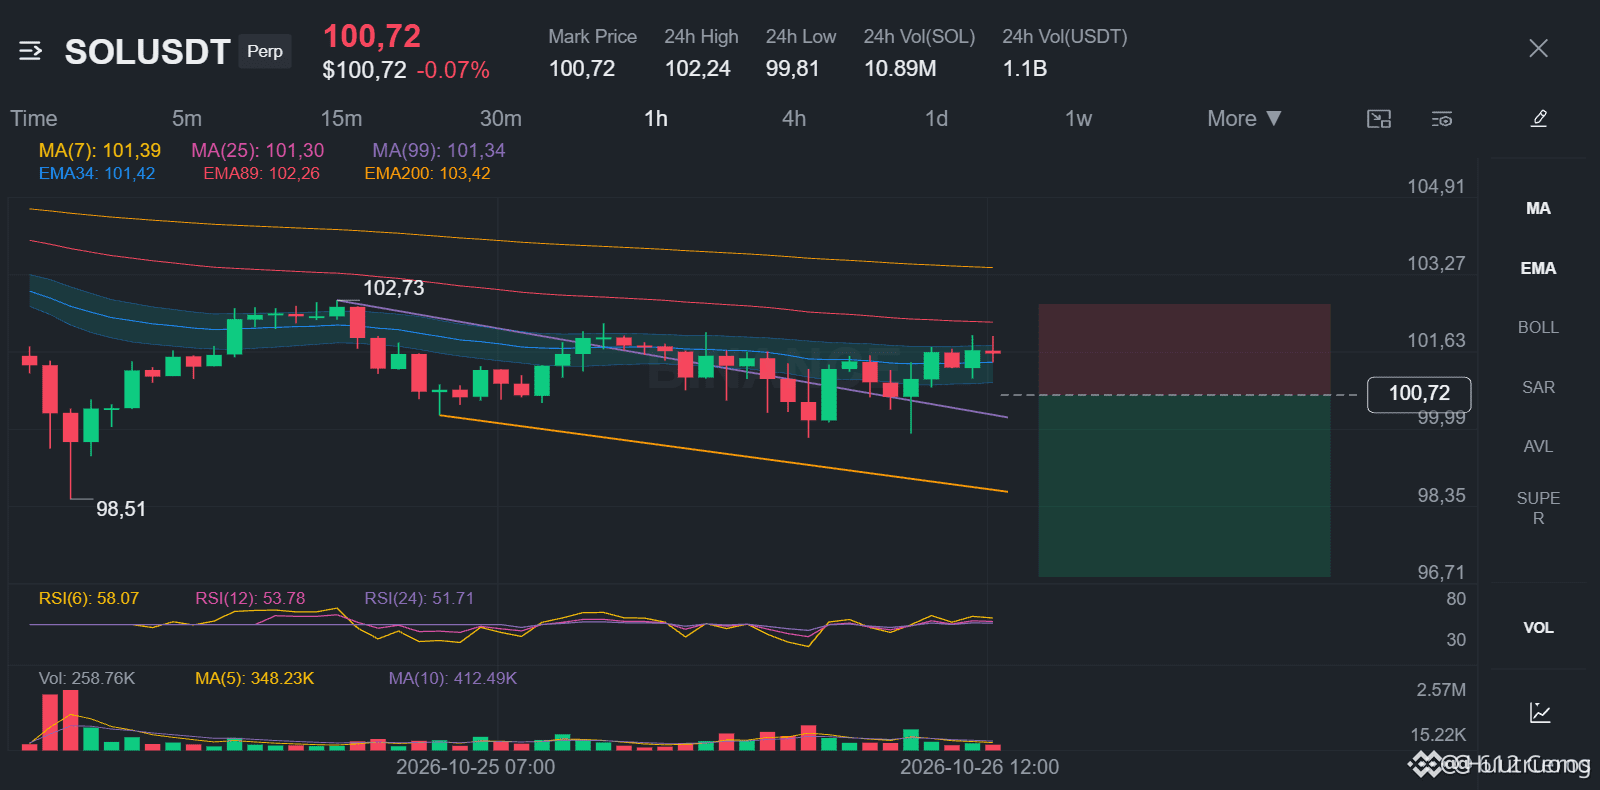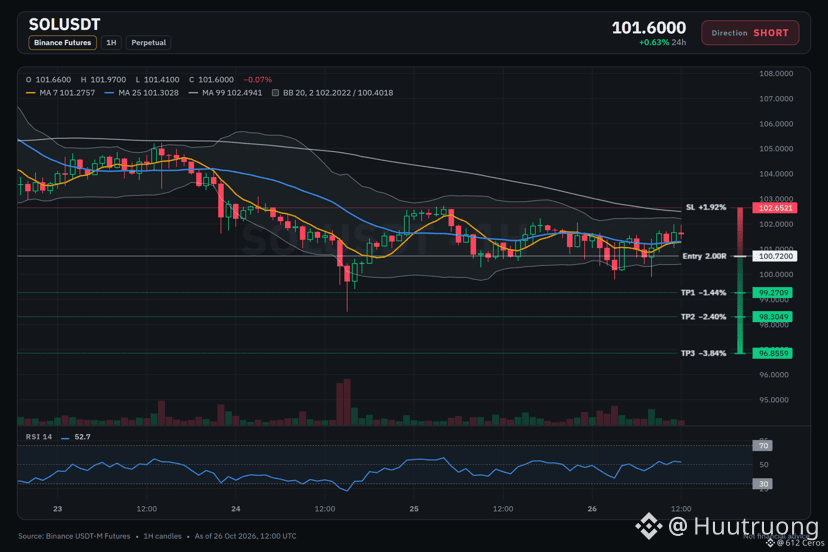
SOL keeps sliding under stacked EMAs on the 4h.
🔴 SHORT $SOL /USDT: expecting price to go DOWN
Bias: SHORT · Leaning
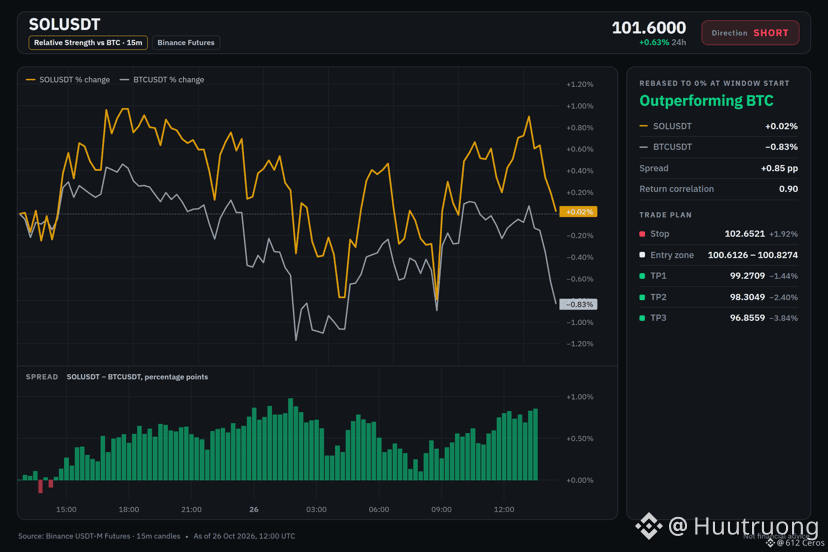
Entry: 100.6126 – 100.8274
TP1: 99.2709 (-1.4%)
TP2: 98.3049 (-2.4%)
TP3: 96.8559 (-3.8%)
SL: 102.6521 (+1.9%)
Plan: enter only inside the zone, close 50% at TP1, 25% at TP2, 25% at TP3, and move the stop to entry after TP1.
Note: moderate conviction only, keep size light.
Why SHORT? 3/12 signals agree, 1 against.
• 4h trend down (below EMA50 & EMA200)
• 1h trend down (below EMA50 & EMA200)
• Volume backs the sellers (volume z +3.9)
Risk: Stronger than BTC (+1.01% 24h vs BTC)
SOL in 3 points:
1/3 The 4h trend shows price below EMA50 below EMA200, a bearish stack.
2/3 The 1h trend also shows price below EMA50 below EMA200, a bearish stack.
3/3 The setup fails if price pushes above entry at 100.6126 and holds there.
What is your invalidation level for this SOL short?