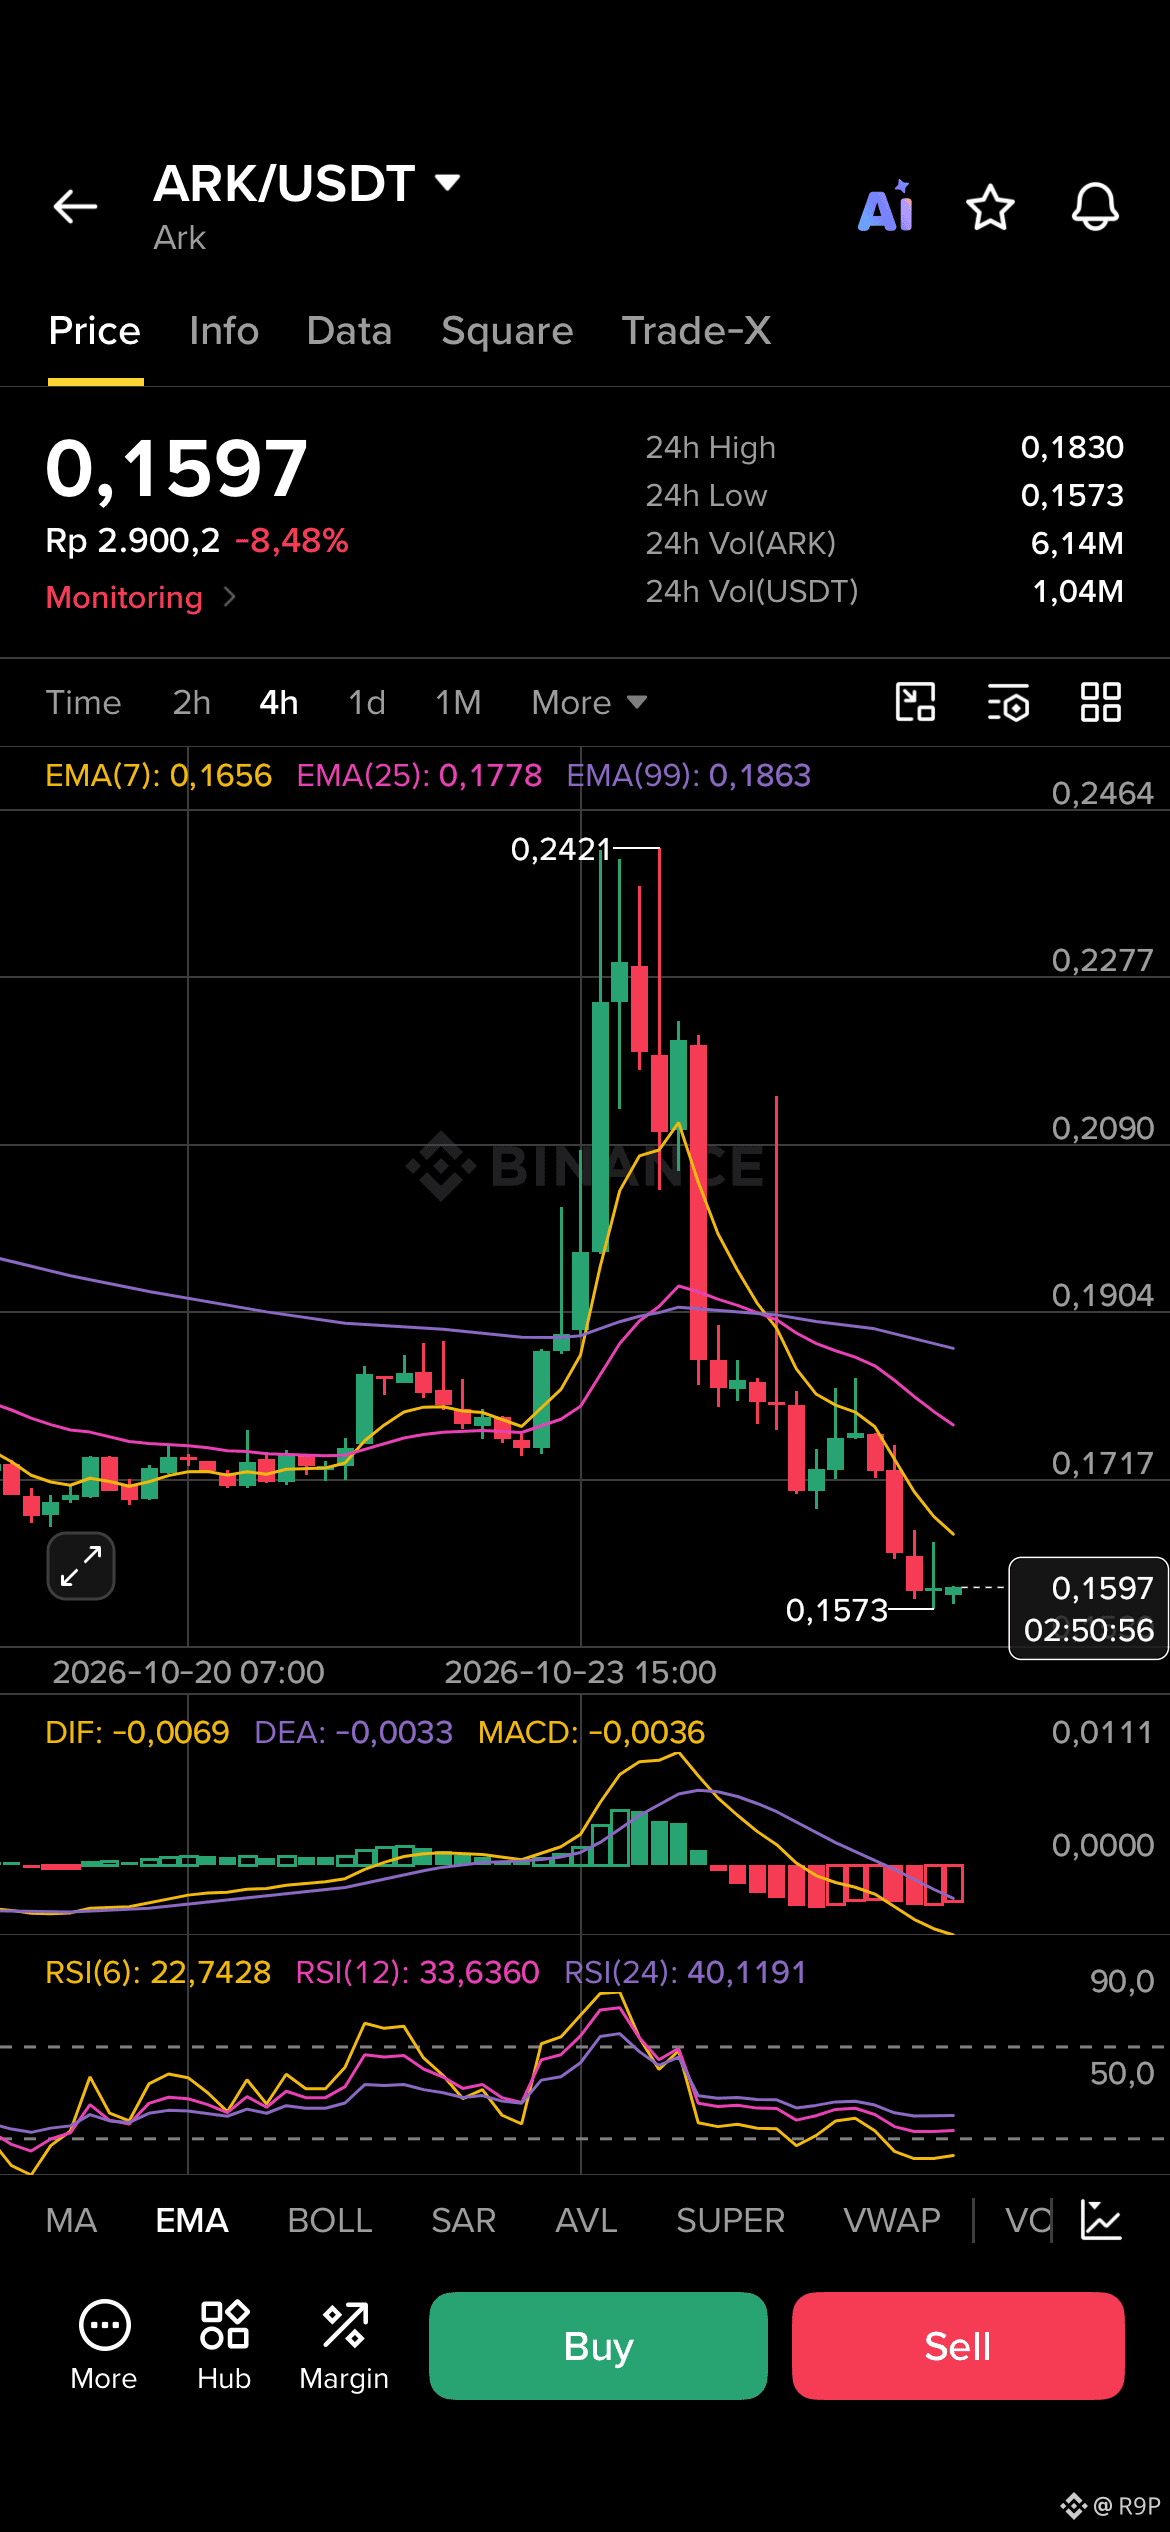
Don't fall for the capitulation trap! Following a sharp correction from its local peak of 0.2421, the 4H chart for $ARK is testing a critical structural support floor at 0.1573, currently trading at 0.1597 (-8.48%)!
3 Technical Highlights of This Setup:
Deep Oversold RSI Status: RSI(6) has plunged down to 22.74 (with RSI(12) at 33.63), indicating extreme seller exhaustion and setting the stage for a strong mean-reversion bounce.
Defending Structural Support: Price is holding firmly right above the 0.1573 local bottom floor, where Smart Money accumulation typically triggers aggressive relief rallies.
The Mean-Reversion Magnet: With price hugging the lower bands below EMA 7 (0.1656), any short-covering wave can quickly target the EMA 25 (0.1778) resistance zone.
4-Hour Bullish Execution Target:
Expecting a sharp technical relief bounce off the support zone, aiming for a retest of the 0.1656 (EMA 7) to 0.1778 (EMA 25) levels over the next 4 hours!
💡 ACTION PLAN FOR TRADERS:
Don't panic sell at the lows! Tap the$ARK