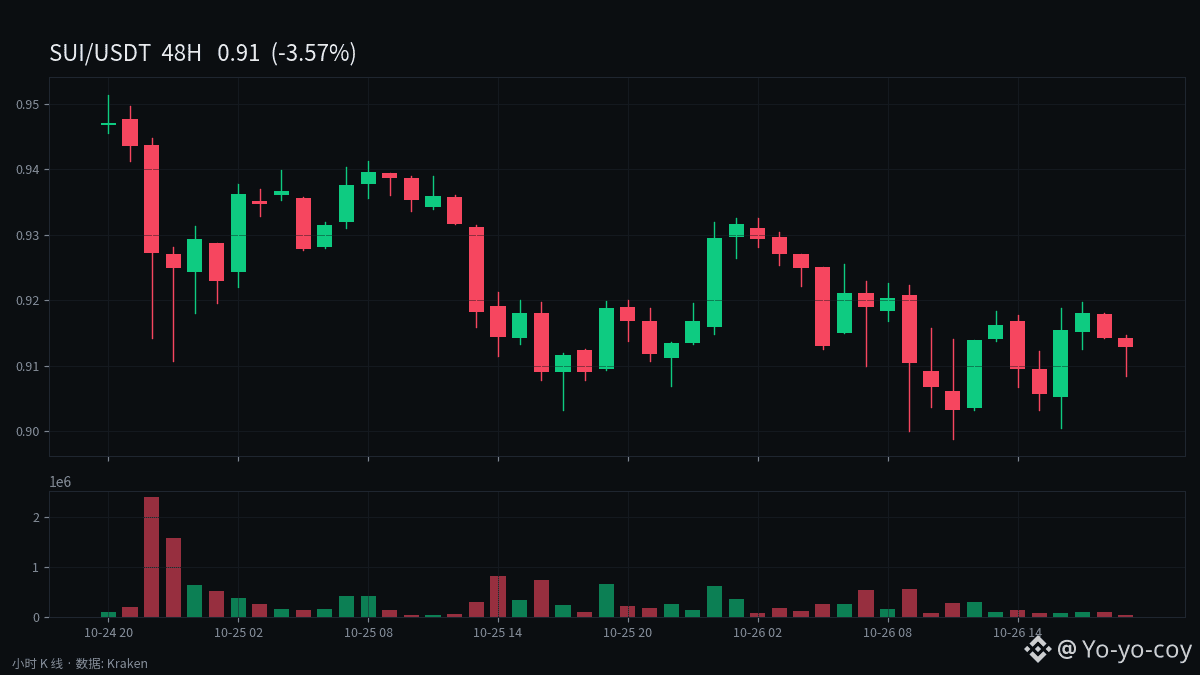
On October 26, SUI remained in a weak structure, with the price near the lower Bollinger Band. All short-term moving averages were above the current price, and there was no evidence of a trend reversal yet.
1. Price levels: An analysis on October 26, 2026, showed SUI trading at around $0.91 on Binance spot, with an intraday range of approximately $0.90 to $0.93 and a narrowing trading range. Another snapshot from the same day reported a price of about $0.9182. Both readings were within the same narrow range.
2. Moving average resistance: The 7-day moving average was around $0.97, the 50-day around $0.99, and the 20-day around $1.02. The 12-period and 26-period exponential moving averages were approximately $0.98 and $1.01, respectively—all above the current price. The only reference point below was the 200-day moving average at around $0.87, which may provide a longer-term reference.
3. Bollinger Bands and medium-term performance: Notably, the upper, middle, and lower Bollinger Bands were around $1.14, $1.02, and $0.90, respectively, with %B at approximately 0.0502. The price was almost touching the lower band. Data from the same day showed SUI down about 10.09% over 7 days and 21.27% over 30 days.
Assessment: Being near the lower band is not, by itself, a reversal signal; during a sustained decline, the price can continue to track along the lower band. Going forward, watch whether the 200-day moving average at $0.87 and the lower band at $0.90 hold. Until the price recovers the $0.97–$0.98 area, the structure should still be viewed as weak.
These are solely my personal views and do not constitute investment advice.
#SUI $SUI