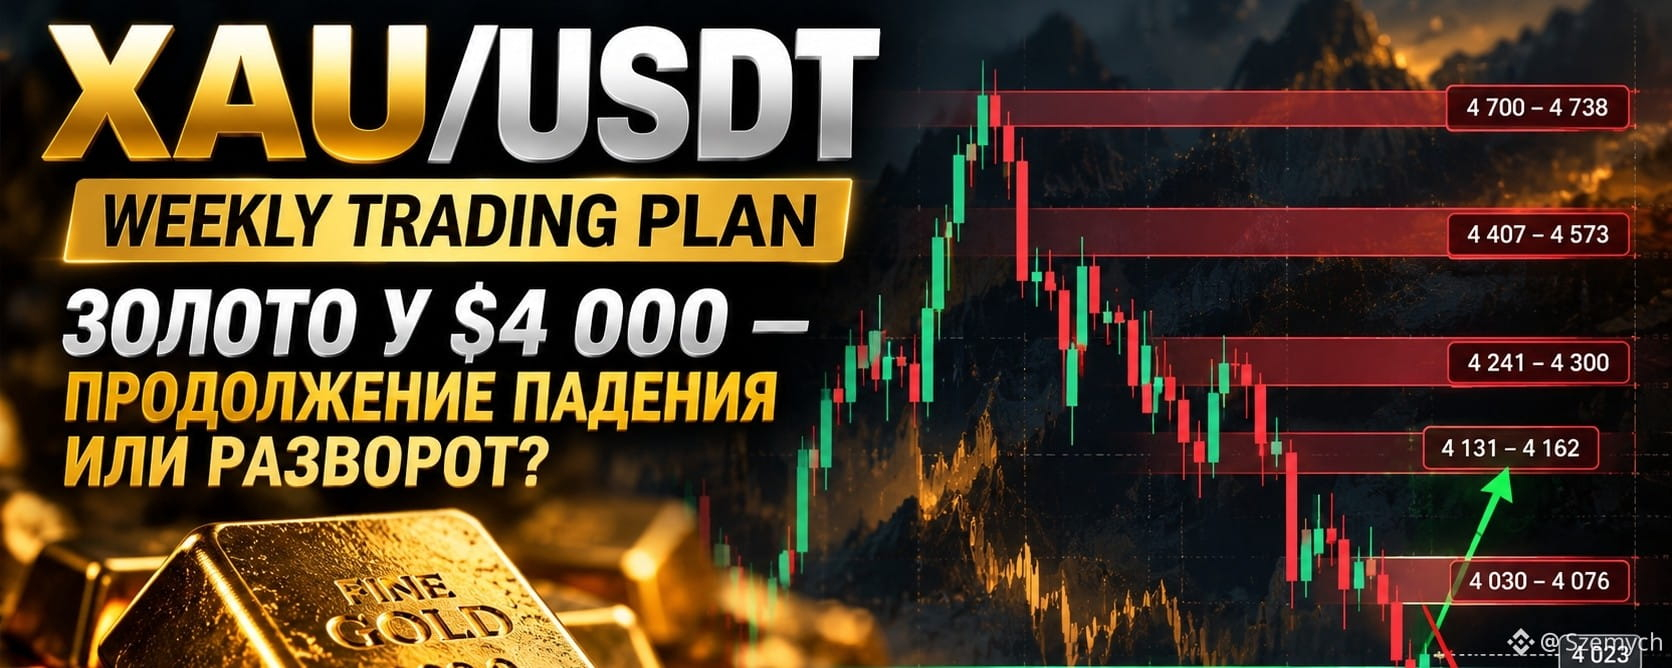

#XAU🥇 $XAU/USDT Weekly Trading Plan: SHORT to $3,948 or reversal from $4,000?
Gold is trying to recover after sweeping downside liquidity, but it has yet to prove that the downtrend structure has been broken. The key is to wait for a correction and find a confirmed SHORT setup rather than selling at the bottom.
📊 Current price: around $4,023
🔻 Main Bias: Bearish
🎯 Priority: SHORT after confirmation on M5
⏳ Status: WAIT — the signal is not yet confirmed
1. HTF Narrative: what did the market do?
After reaching a high of $5 625,34, the market began a prolonged decline. The higher-timeframe charts shown indicate lower highs and a move toward the $3 948–4 000 area.
On the lower timeframes, price swept liquidity beneath the local lows at $3 979–3 986 and recovered to $4 030,38. This shows a buyers' reaction, but does not confirm a full reversal.
Narrative A → B → Invalidation C
A — Previous move: SSL sweep around $3 979–3 986 and a local upward reaction.
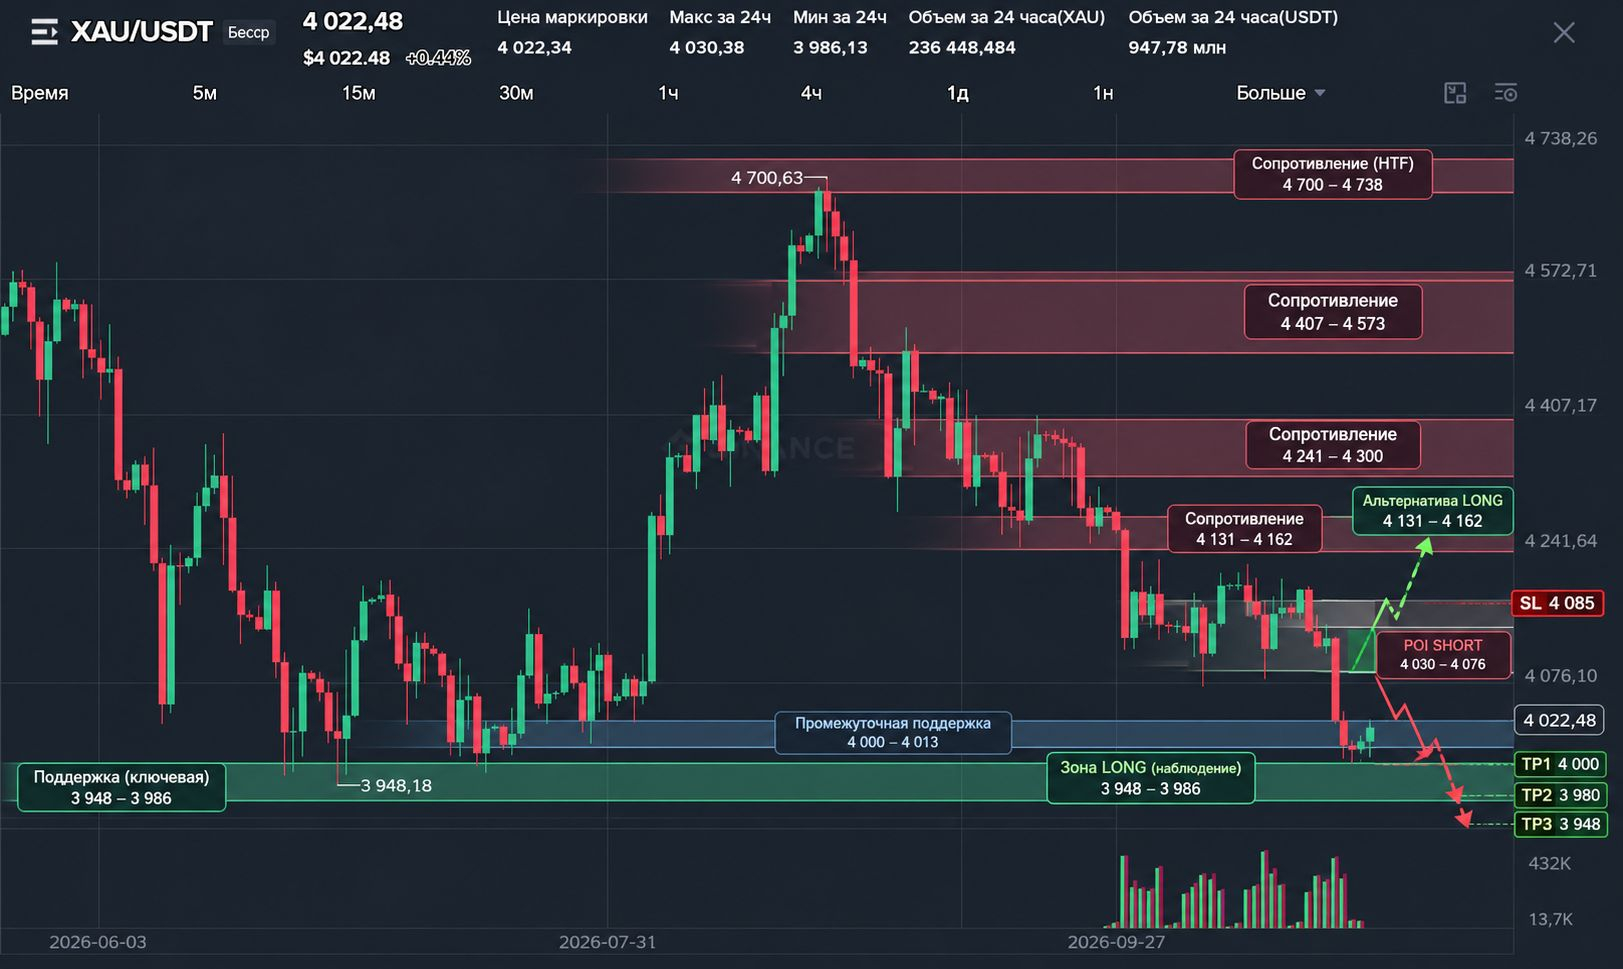
B — Expected Delivery: correction to $4 030–4 076. If sellers confirm control in this zone, the next targets will be $4 000, $3 980, and $3 948.
C — Invalidation: a sustained hold above $4 076 will weaken the local SHORT scenario. A hold above $4 162,64 on H1 will significantly weaken the overall bearish bias.
2. Key Levels & Liquidity
🔴 Resistance:
$4 030,38 — local recovery high.
$4 076 — nearest key reaction zone.
$4 131–4 162 — next resistance area.
🟢 Support and lower liquidity:
$4 000–4 013 — nearest support area.
$3 986,13 — local low.
$3 979,21 — previous low.
$3 948,18 — key range low.
Dealing Range: $3 948–4 162.
Equilibrium: approximately $4 055.
The current price is in Discount relative to this range, but that is not a standalone LONG signal. In a bearish context, the market may continue to decline.
3. Main Scenario — SHORT
POI: $4 030–4 076. This is an area to watch, not an automatic entry.
The planned Entry is considered only after the following sequence on M5:
Price reaches the POI and sweeps local BSL.
Bearish MSS forms.
Downward displacement appears.
Price returns to retest the formed FVG/IFVG.
Entry is considered only after confirmation.
Indicative trading parameters
Entry: $4 050
Stop Loss: $4 085
TP1: $4 000
TP2: $3 980
TP3: $3 948
Risk per position unit: $35
Metric
Price
Potential
RR
Entry
$4 050
—
—
SL
$4 085
−$35
1R
TP1
$4 000
+ $50
1:1,43
TP2
$3 980
+ $70
1:2,00
TP3
$3 948
+ $102
1:2,91
RR calculated for a SHORT from $4 050 with an SL at $4 085, excluding fees and slippage.
Important condition: $4 050 is the planned price, not a confirmed Entry. Entry is permitted only if the actual M5 retest forms a confirmed setup near this level. If the structure, FVG/IFVG, or stop placement does not match the plan, do not enter and do not force the signal to fit the price.
Invalidation of the main scenario
A sustained hold above $4 076 on H1 calls for reassessing the local idea. The $4 085 stop limits the risk of a specific position, but does not replace structural analysis. If price holds firmly above $4 162,64, the bearish scenario must be reassessed.
4. Plan B — LONG from lower liquidity
The alternative is considered if the $3 948–3 986 area is retested.
Look for:
a sweep of SSL;
bullish MSS on M5;
upward displacement;
FVG/IFVG retest.
If confirmed, potential targets are $4 030 and $4 076.
It is not practical to predefine the Entry and SL for a LONG: the charts provided do not show a confirmed setup from which a stop can be placed correctly. Once the structure forms, determine the entry point, invalidation level, and RR again.
5. Plan for the Week
Main scenario: wait for a correction to $4 030–4 076 and SHORT confirmation on M5.
Planned Entry: $4 050, only if it coincides with a confirmed retest.
SL: $4 085.
Targets: $4 000 → $3 980 → $3 948.
Potential RR: 1:1,43 / 1:2,00 / 1:2,91.
Plan B: LONG after a sweep of lower liquidity and confirmed bullish MSS.
Current status: WAIT. Do not chase the price or open a trade before confirmation.
Calculate risk per trade based on the stop and position size. For example, with an acceptable loss of $100 and a $35 distance to the SL, the calculated position size is about 2.86 units of the underlying instrument, before fees and contract specifics. For a perpetual XAU/USDT contract, also check the instrument specifications.
Summary
Gold reacted from lower liquidity, but a reversal has not yet been proven. The main opportunity is to wait for a correction and look for a confirmed bearish setup, rather than selling after the impulse has already occurred.
POI ≠ Entry. No Sweep → MSS → Displacement → FVG/IFVG Retest on M5 — no trade.
💬 Which scenario are you expecting: SHORT to $3 948 or a recovery above $4 076? Share your view and the level that would confirm your hypothesis.
#XAUUSDT #Gold #TradingPlan #Liquidity #TechnicalAnalysis