

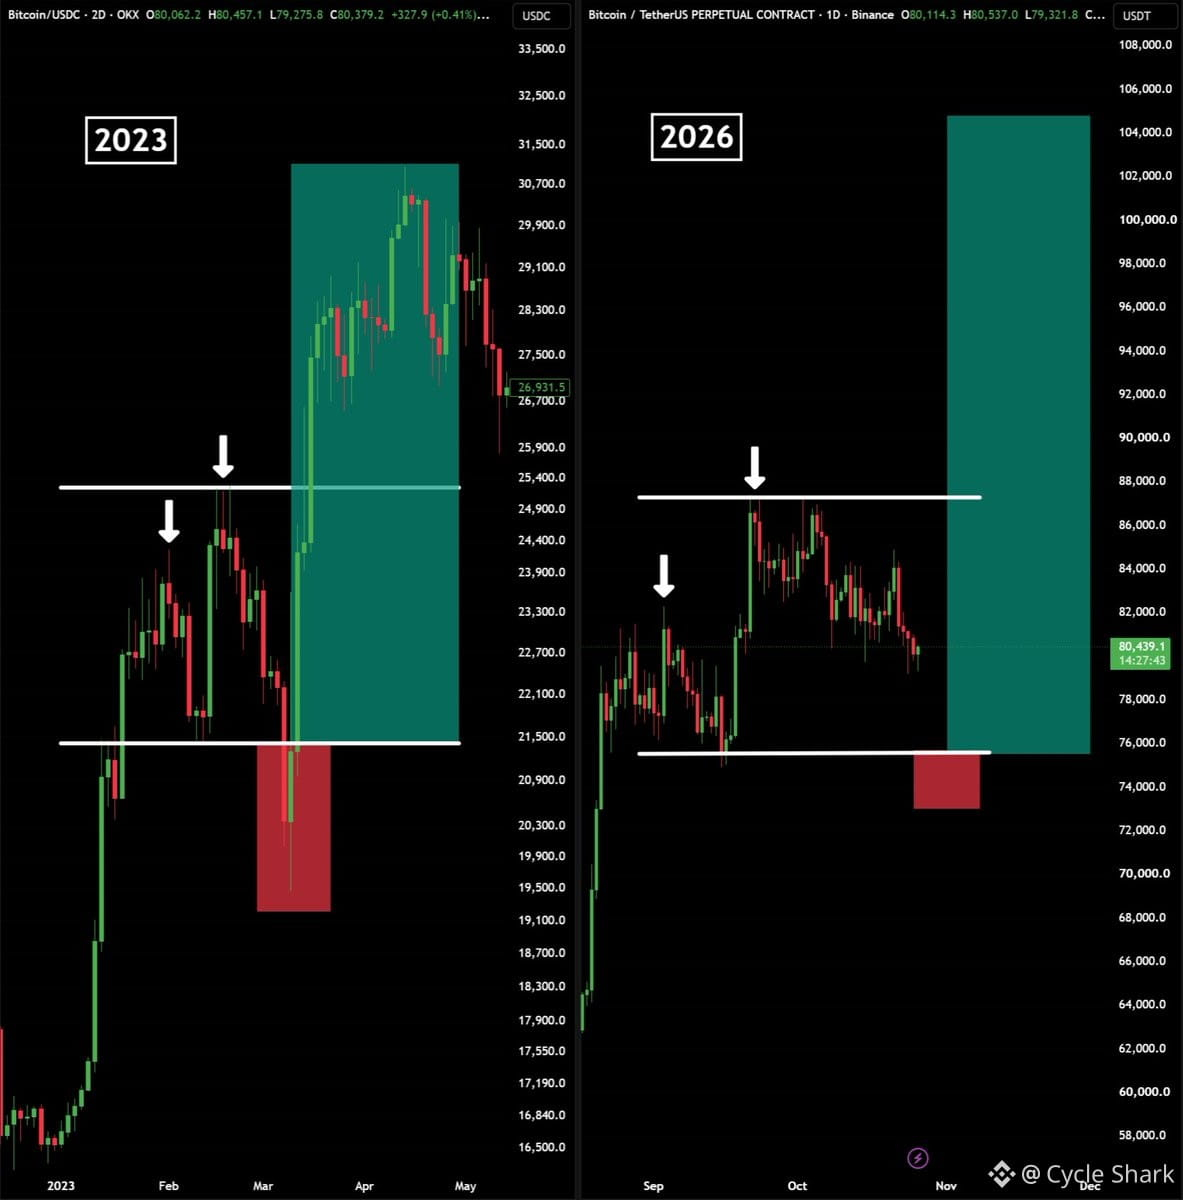
$BTC fractal patterns showing potential repeat of previous cycle structure. Looking at on-chain metrics and price action from 2016-2017 vs current setup — similar accumulation zones, similar macro liquidity conditions, similar post-halving timeline. Not saying it's guaranteed, but the rhyme is there. If history holds, we're somewhere between disbelief and hope phase. Next 6-8 months will tell if this fractal actually plays out or breaks down.

Join global crypto users on Binance Square
⚡️ Get latest and useful information about crypto.
💬 Trusted by the world’s largest crypto exchange.
👍 Discover real insights from verified creators.
Email / Phone number