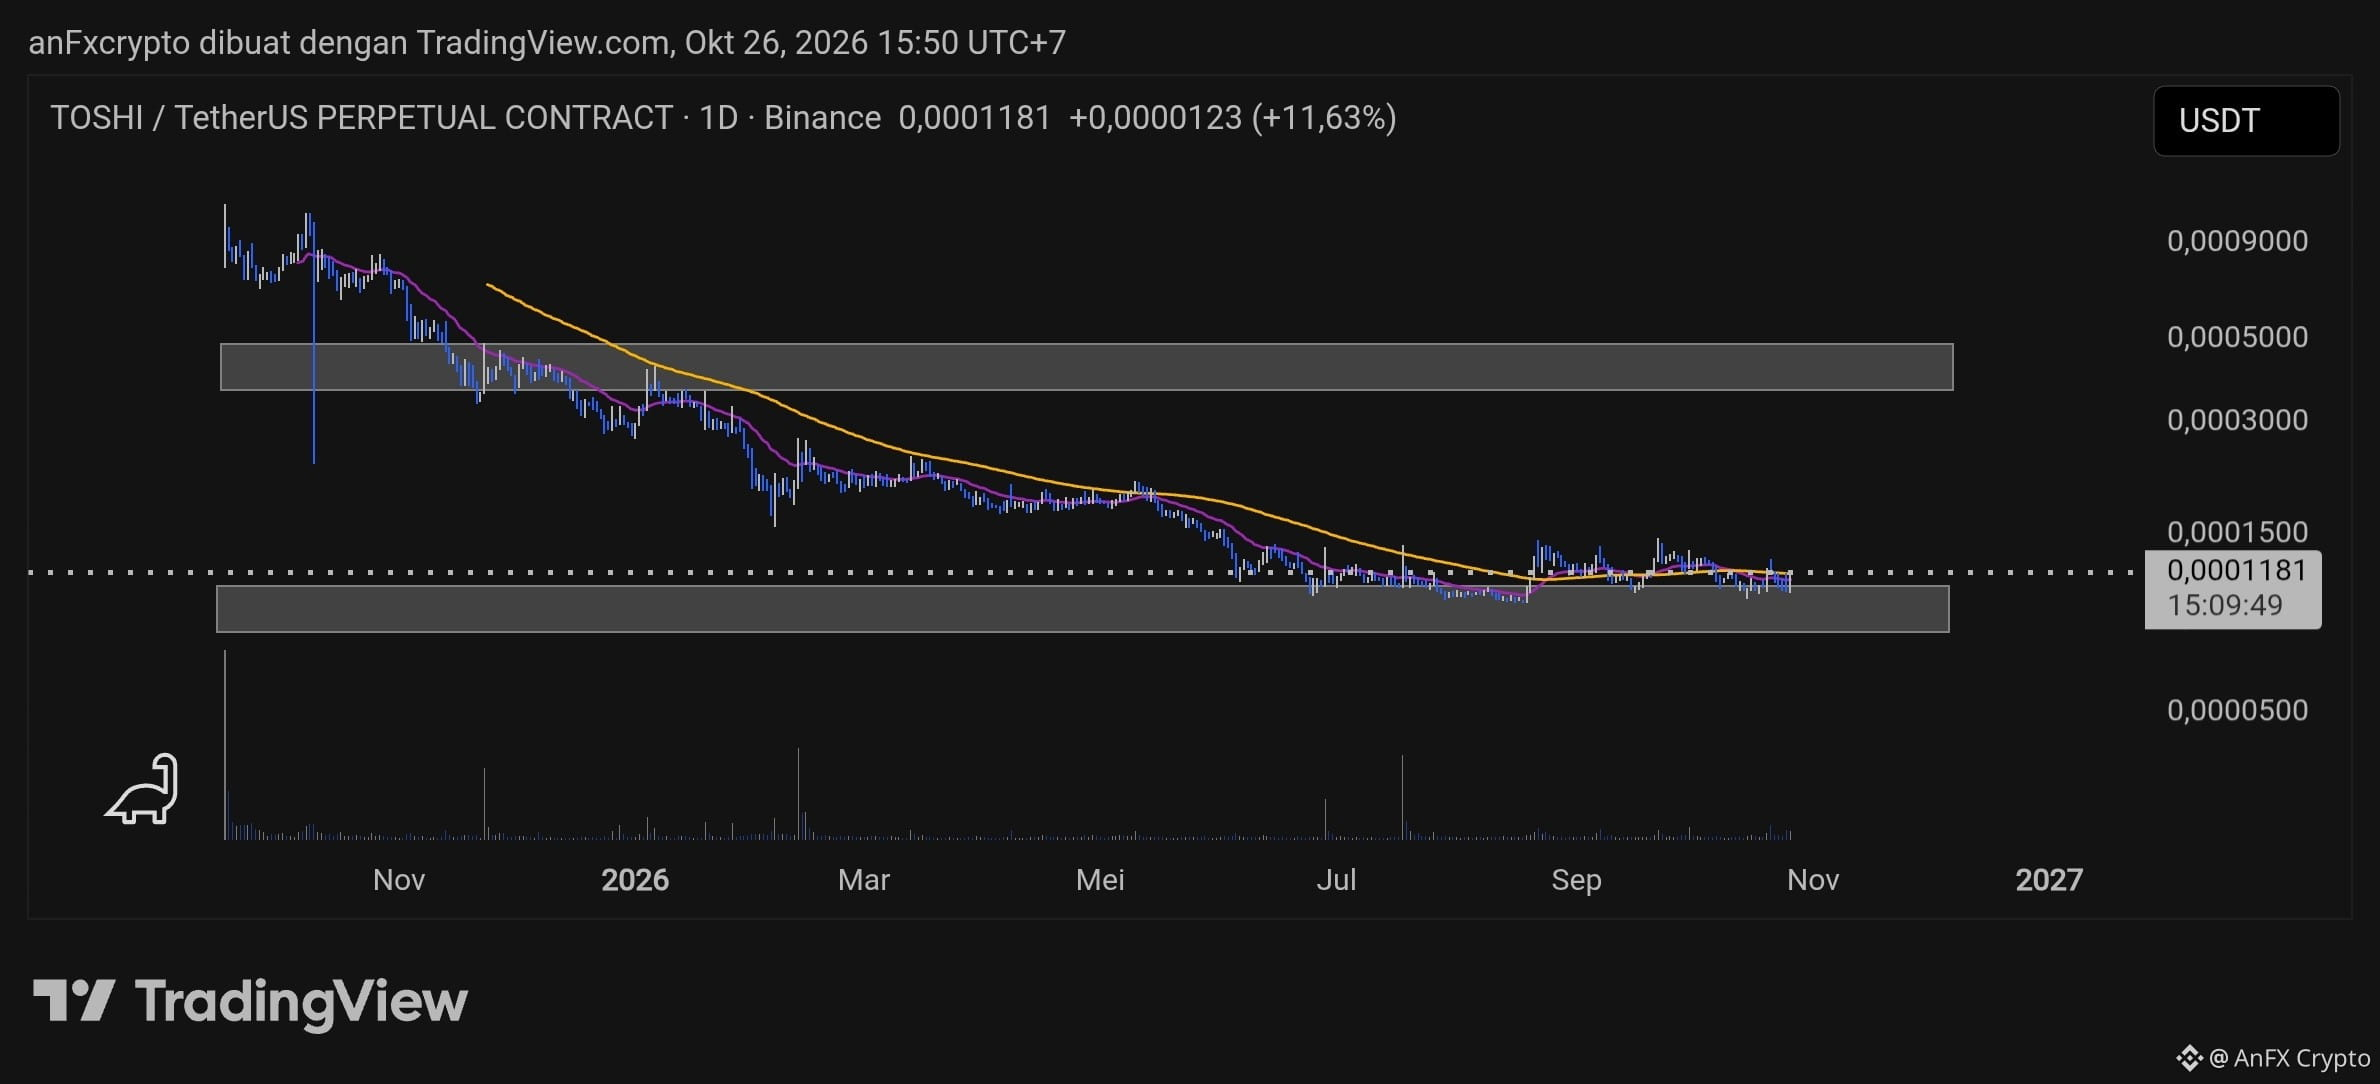
Technical Analysis of $TOSHI /USDT (Daily Timeframe):
Market Trend: The long-term trend is in a strong bearish phase (the price structure is forming lower highs and lower lows below the major moving average lines).
Current Price Zone: Moving sideways (consolidating) around 0.0001181, holding above a key support area.
Indicator: Daily trading volume appears thin, suggesting market participants are waiting for a catalyst or a further breakout.
Trading Signal (Futures / Spot):
Direction: Neutral to Speculative Long (Short-Term Rebound)
Buy Entry (Accumulation Zone): 0.0001100 – 0.0001181
Take Profit (TP):
TP1: 0.0001350
TP2: 0.0001500
Stop Loss (SL): Below 0.0001000 (to limit risk if support is breached)
Risk Recommendation: Use low leverage (maximum 3x–5x), given the volatility of meme assets/small-cap altcoins and the still-bearish macro trend.