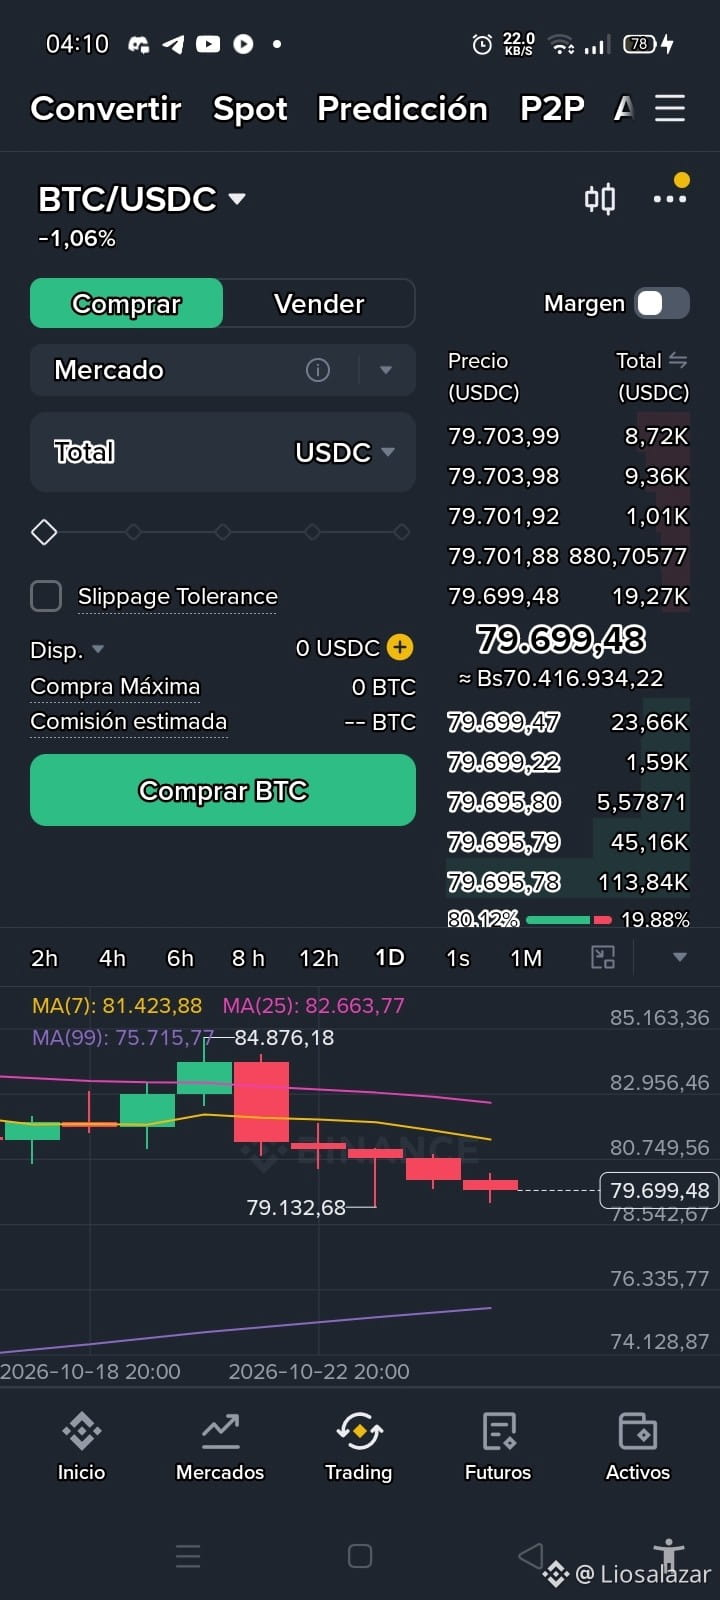
📊 Market Analysis (BTC/USDC) 🟢
Pair: BTC/USDC on the Spot interface
Current Price: $79,699.48 USDC
Trend: Down 1.06% on the daily chart, showing a corrective move toward the support zone near $79,132.68.
Moving Averages (MA): MA(7) at 81,423.88, MA(25) at 82,663.77, and MA(99) at 75,715.77 reflect short-term bearish pressure as price stability above the long-term average is assessed.
💡 Strategy: Closely monitor current support levels on the 1-day chart to identify potential accumulation points or tactical Spot entries as the market digests recent volatility.
💬 How are you adjusting your Spot buy or sell positions in response to this BTC price movement? I’d love to hear from you in the comments! 👇
$BTC USDCBNB