$BTC 【Bitcoin is currently near the lower boundary of a bullish continuation flag pattern. Another dip is a great opportunity to buy the bottom and add to your position.】
Bitcoin is trading around 80,000.
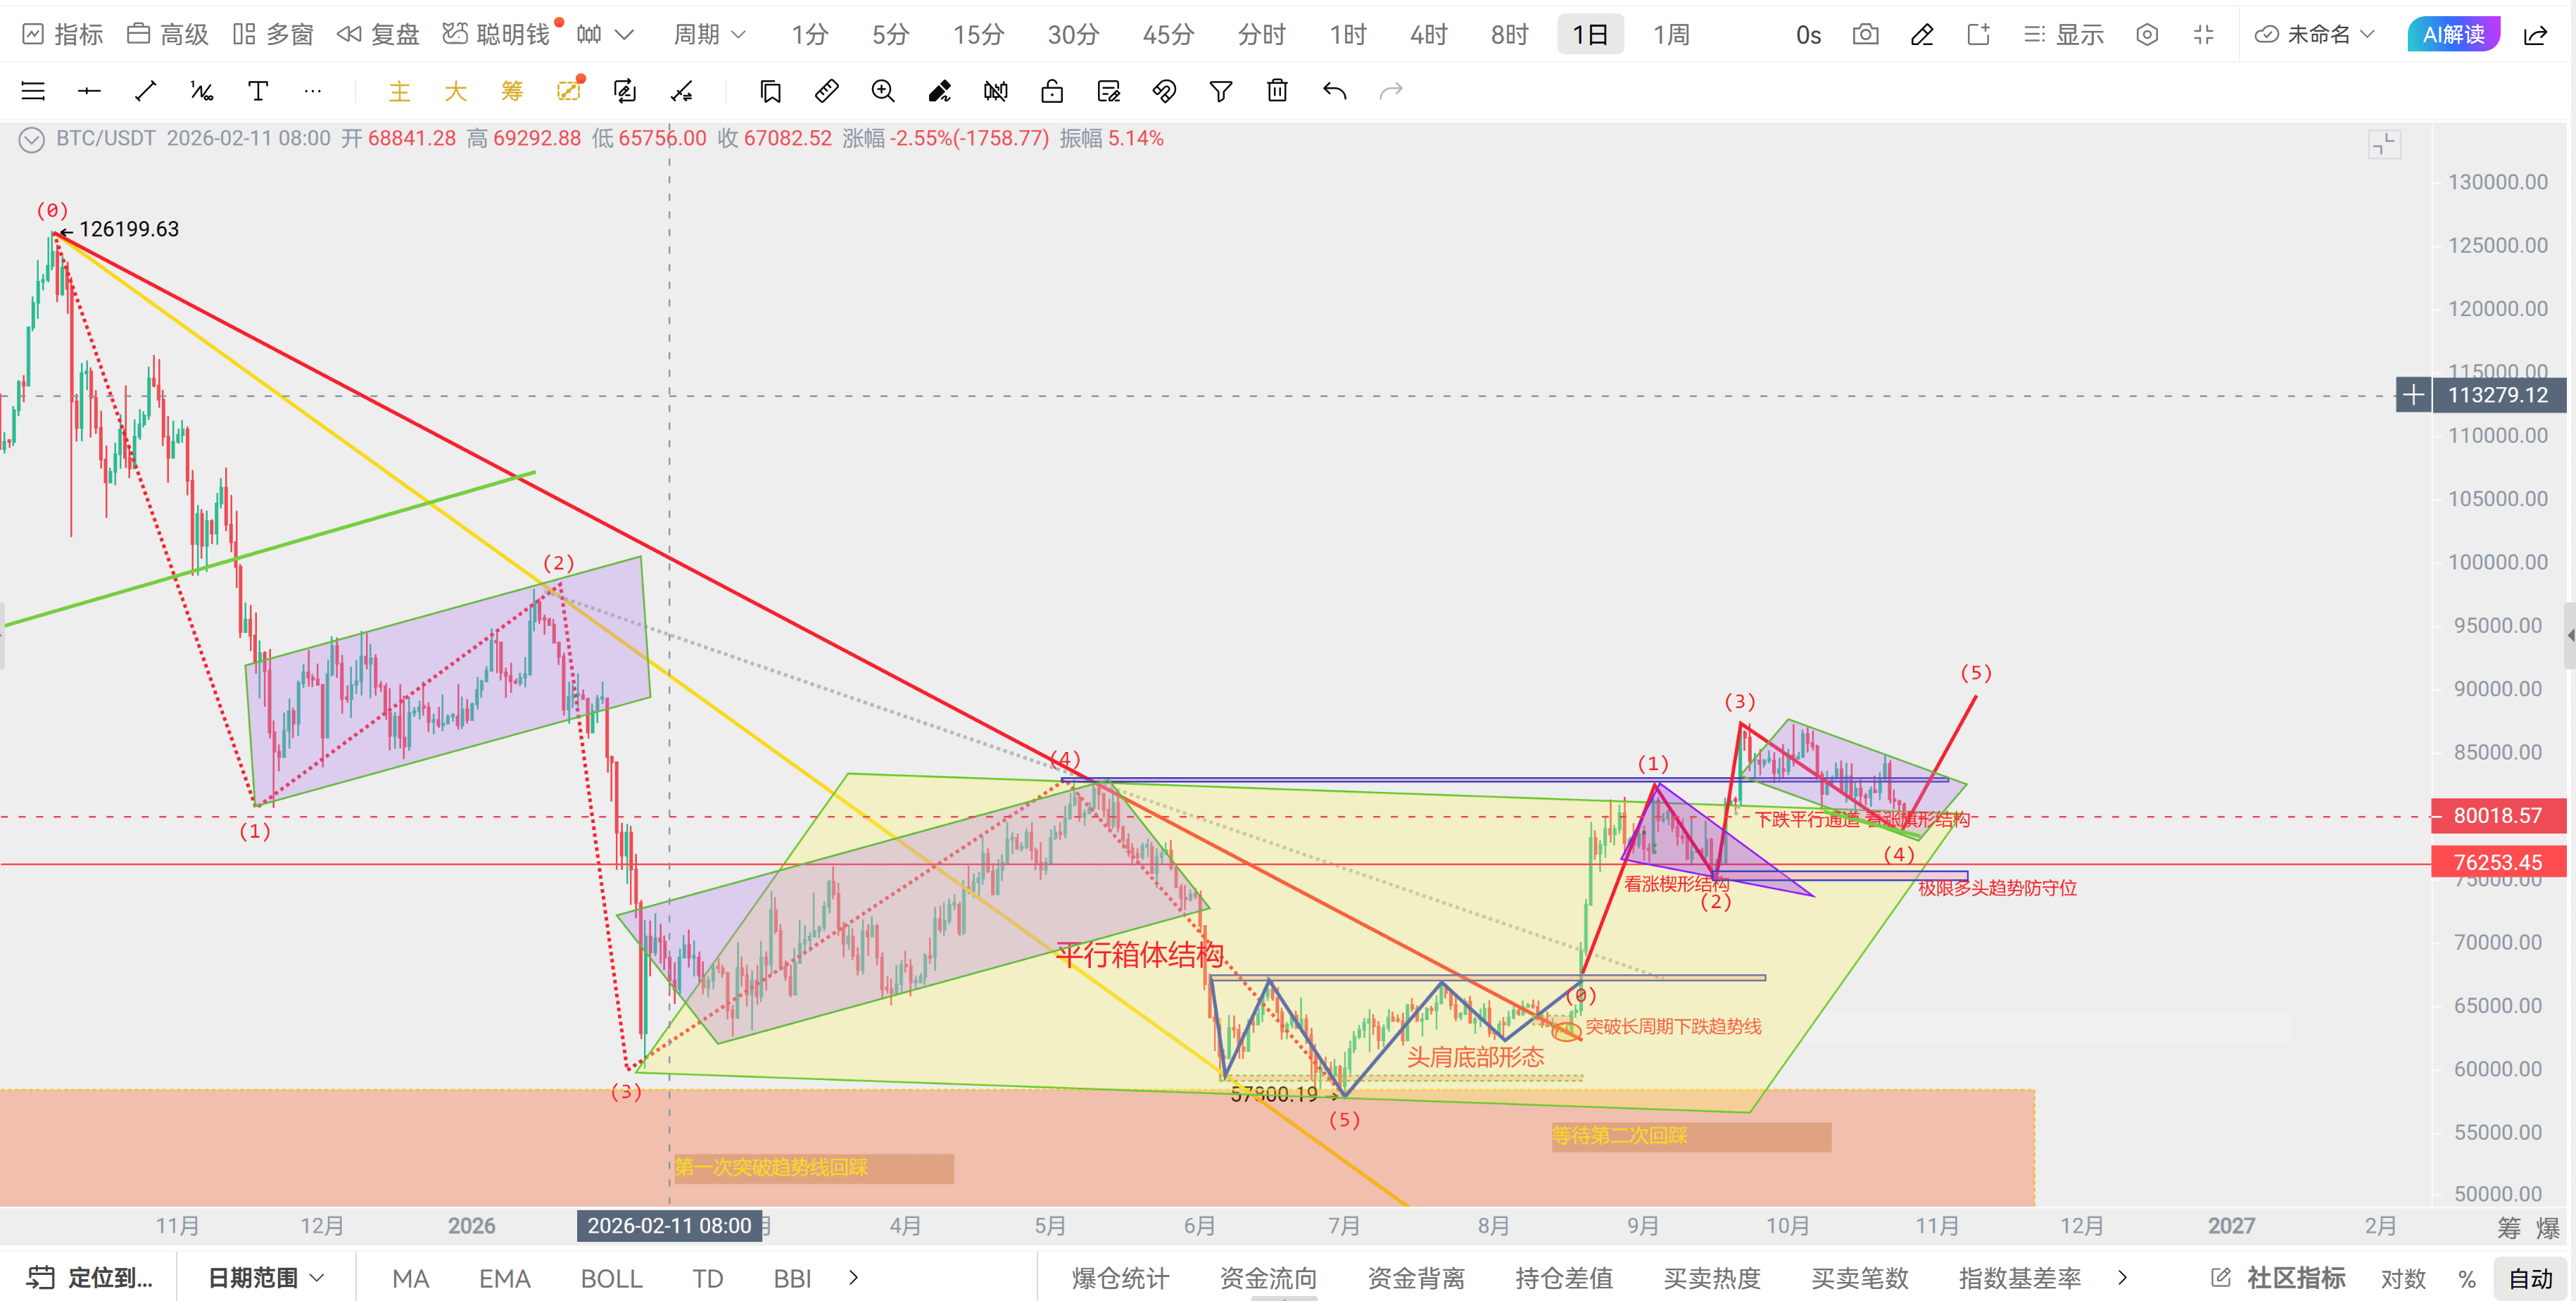
Structure chart 1: For now, we’re still looking at the structure below. After Bitcoin’s inverse head-and-shoulders bottom formed and confirmed the bear-market low, it surged to the upper boundary of the yellow parallel channel, then moved down and consolidated, forming a bullish continuation wedge. After correcting to the lower boundary, it surged again to 87,000+, then moved down and consolidated, forming the current bullish continuation flag pattern.
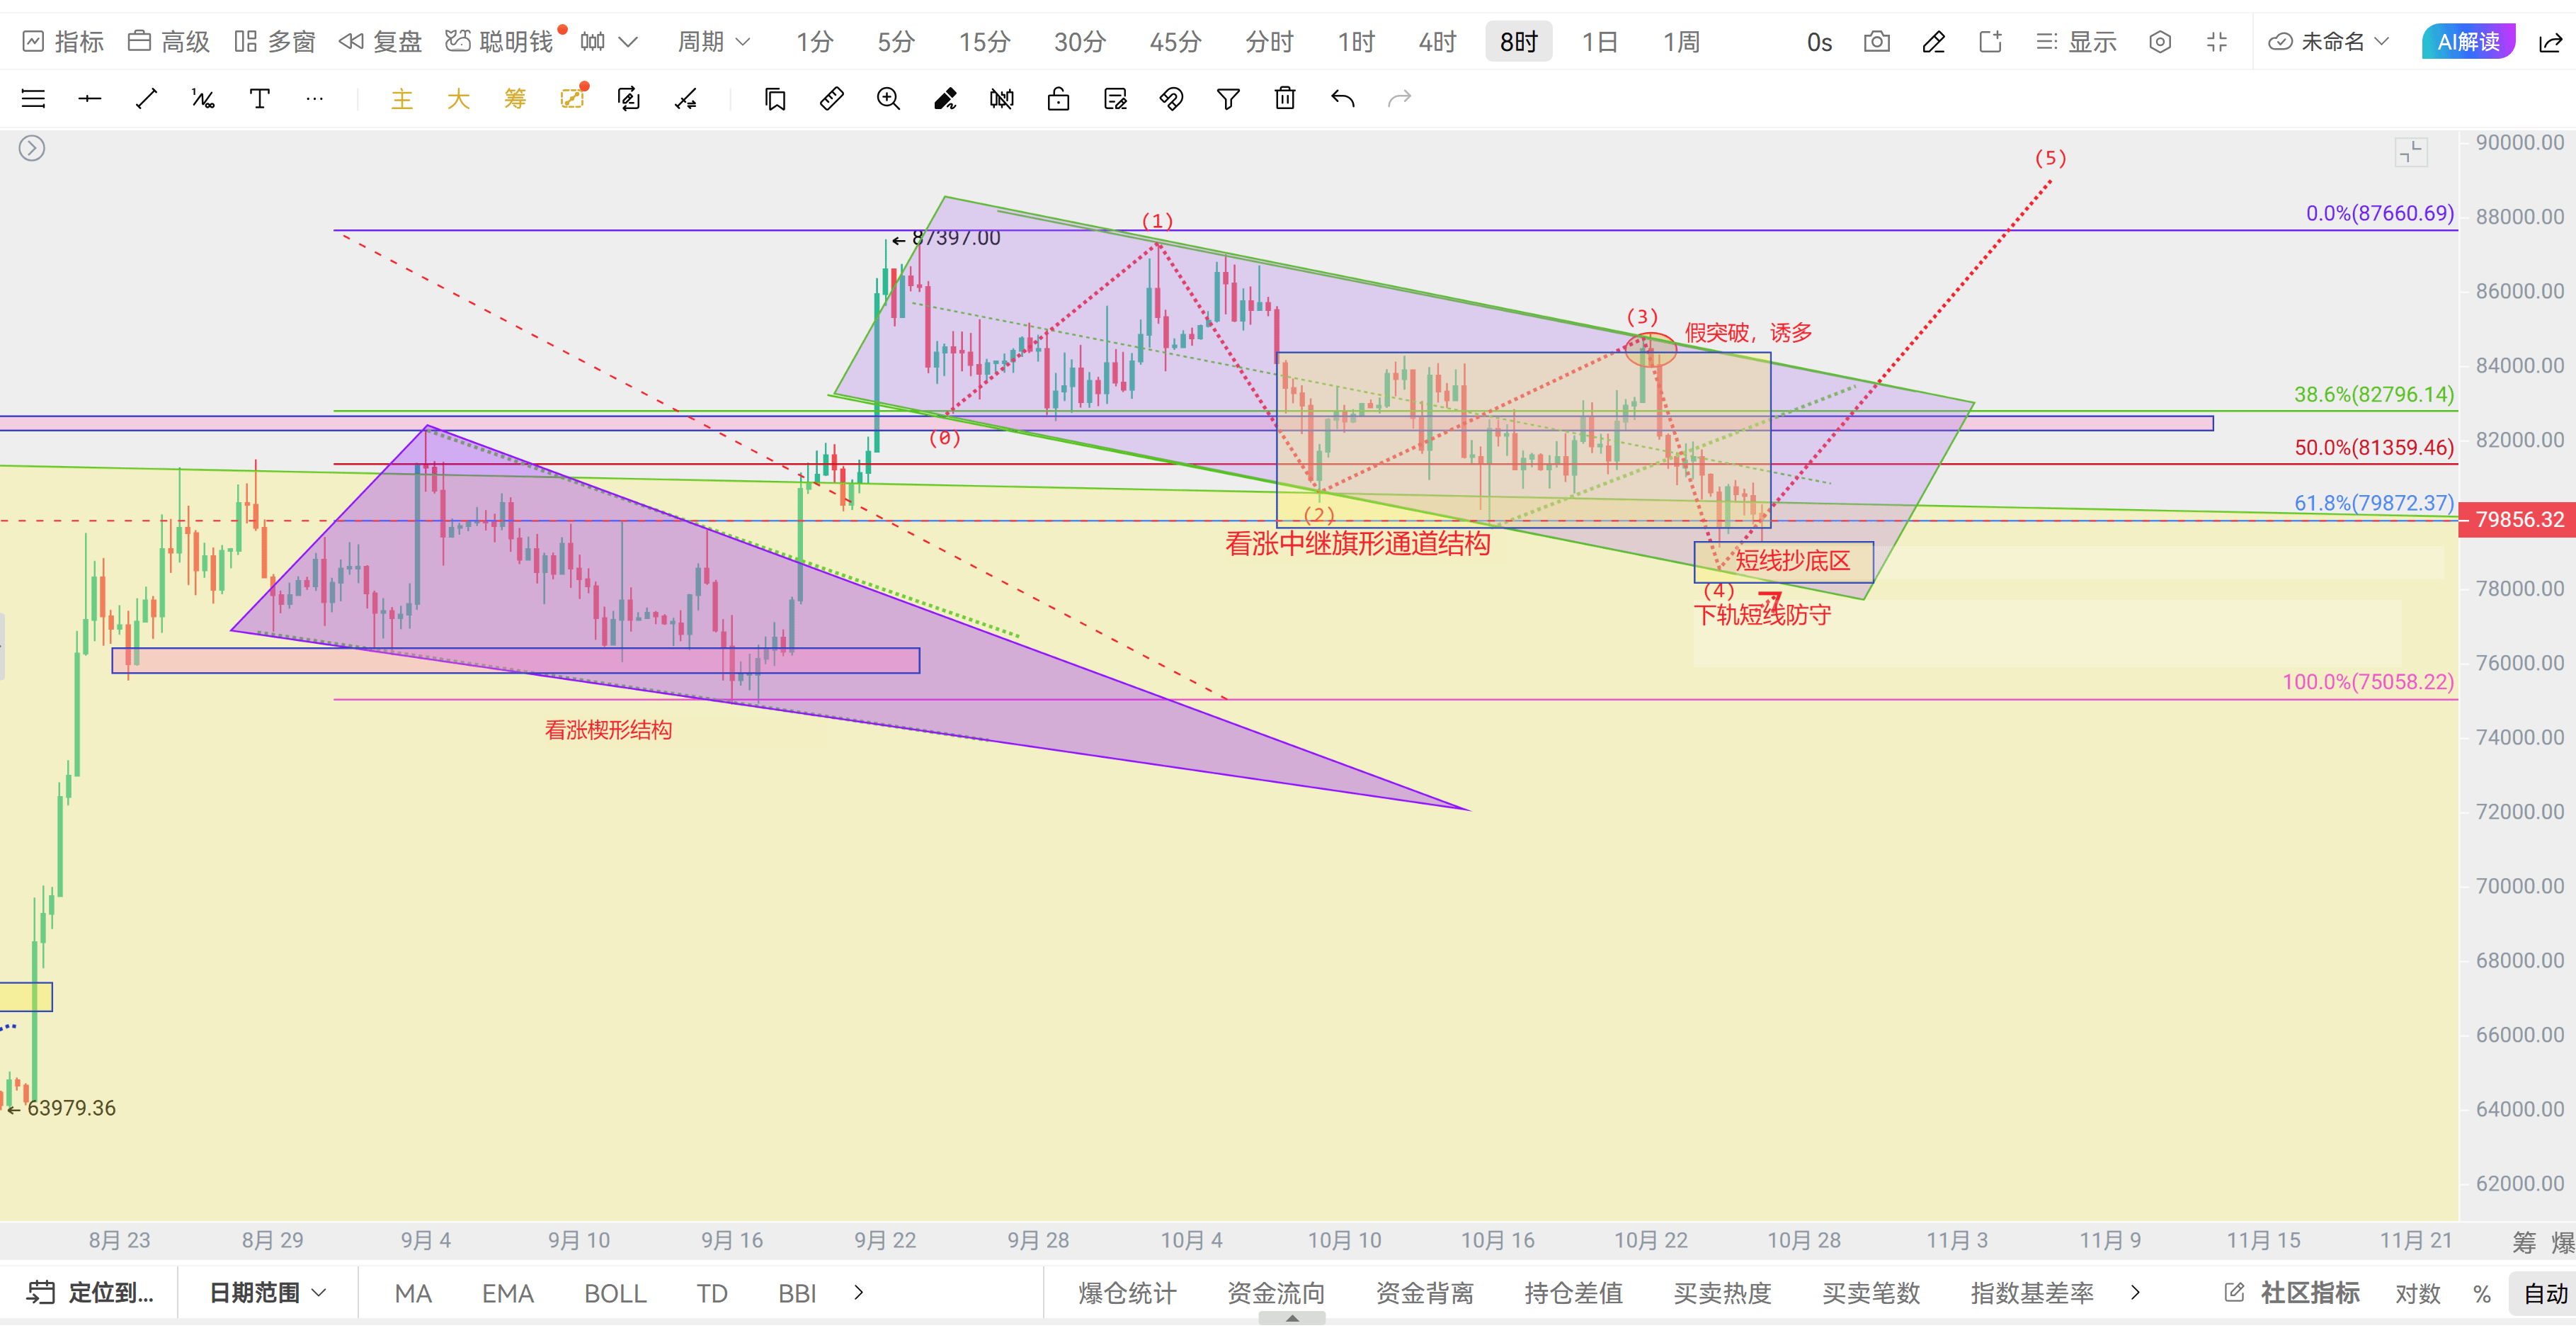
Now let’s look at chart 2: the bullish continuation flag pattern. Bitcoin is currently close to the lower boundary, which offers relatively strong support. This period of consolidation has also lasted long enough. Whether in a bear or bull market, price movements don’t happen in one uninterrupted move. There are always rebound-and-consolidation structures during declines, or pullback-and-consolidation structures during rallies. So this bullish continuation flag should finish correcting soon, and the next upward wave should follow shortly.
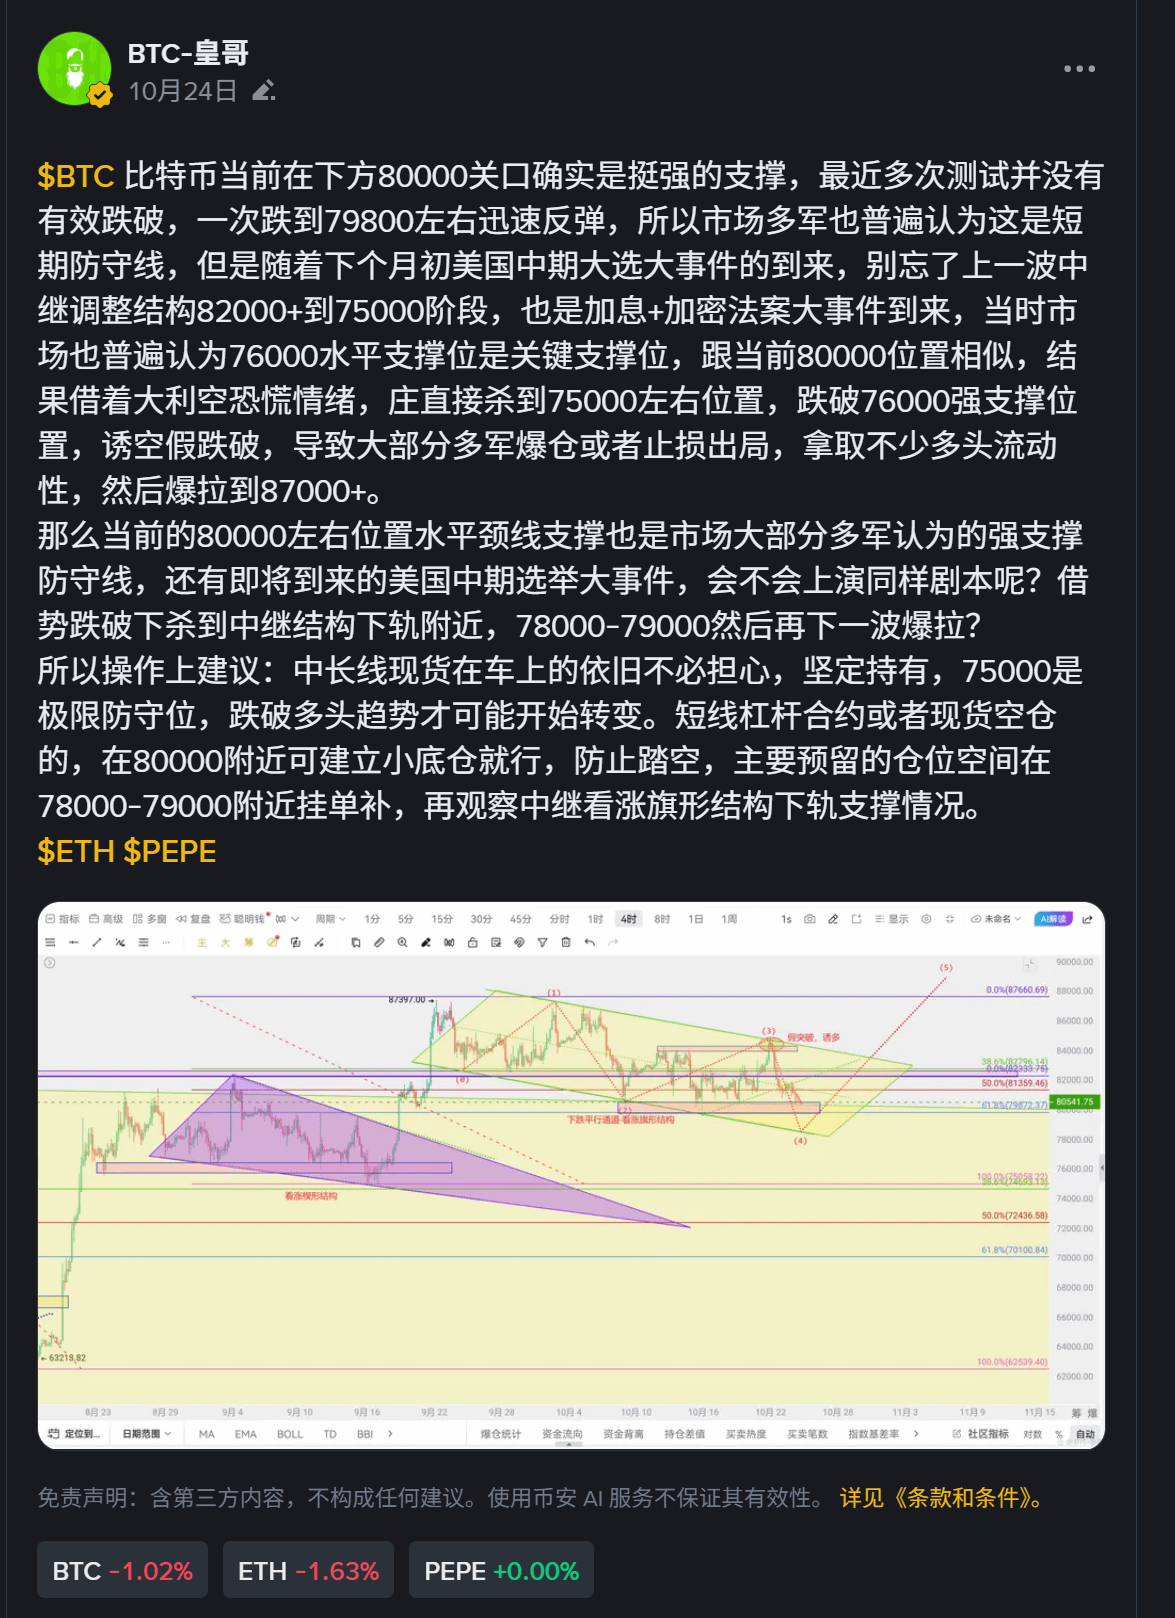
Also, with major events such as the upcoming U.S. Federal Reserve rate decision and midterm elections, there’s a chance we could see a repeat of the previous consolidation from around 82,000 to 75,000. Refer to chart 3: this is the analysis shared a couple of days ago.
So my trading recommendation remains: focus on buying the dip in the 78,000–79,000 range. Following the recommendation from the day before yesterday, Huang-ge has already built a core position of around 15% with 5x leverage near 80,000. When the price fell to just above 79,100 at the weekend low, he added one lot. The current average entry price is just above 79,500, with a position of around 33%. If the price reaches the 78,000–79,000 range, he’ll increase the position to around 70%, then decide on take-profit and stop-loss levels based on how the lower-boundary support holds. This can be used as a reference. Since the upper and lower boundary levels shift over time, keep monitoring them.
$ETH $SOL