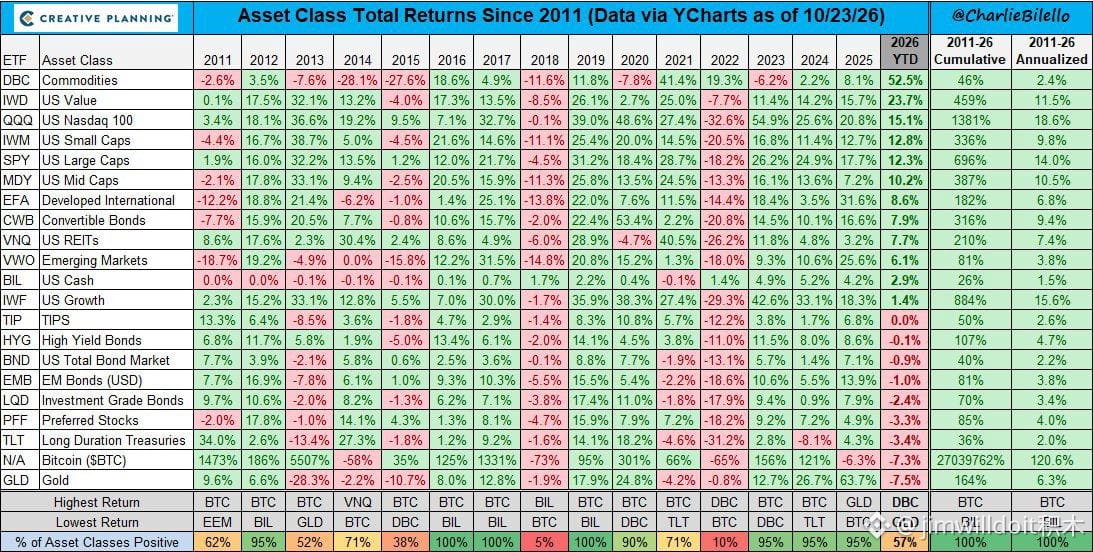
$BTC and gold have both ended up at the bottom!
Bitcoin is down 7.3% year to date.
Gold has fared even worse, falling 7.5%.
Meanwhile, commodities have surged 52.5% against the trend!
Which of these two popular assets will lead the comeback?
The latest annual global asset returns rankings show that, as of October 23, Bitcoin was down 7.3% year to date, while gold had fallen 7.5%, making them the two worst-performing major asset classes on the chart. Meanwhile, the commodities index gained 52.5%, U.S. value stocks rose 23.7%, the Nasdaq 100 climbed 15.1%, and the S&P 500 advanced 12.3%. This points to a clear divergence in global asset performance this year, with capital not flowing in unison toward either traditional safe havens or riskier assets.
What’s really worth noting is that although Bitcoin and gold have both come under pressure this year, their long-term performance has differed significantly. Since 2011, BTC’s annualized return has reached about 120.6% on the chart, compared with 6.3% for gold—but Bitcoin has also seen far greater volatility and drawdowns. Next, watch to see whether BTC can hold above $80,000 and its 50-week moving average below, while keeping an eye on whether gold can regain safe-haven buying support. If macroeconomic uncertainty gradually eases and capital allocation shifts, both assets could have a chance to recover.
Gold and BTC both lagging shows that this year’s capital rotation is far more complex than it seems.
If ETF inflows return and BTC holds its long-term trend support, Bitcoin could still fire the first shot in the comeback!
Tap the card below to get started! 👇
$ETH $ZEC