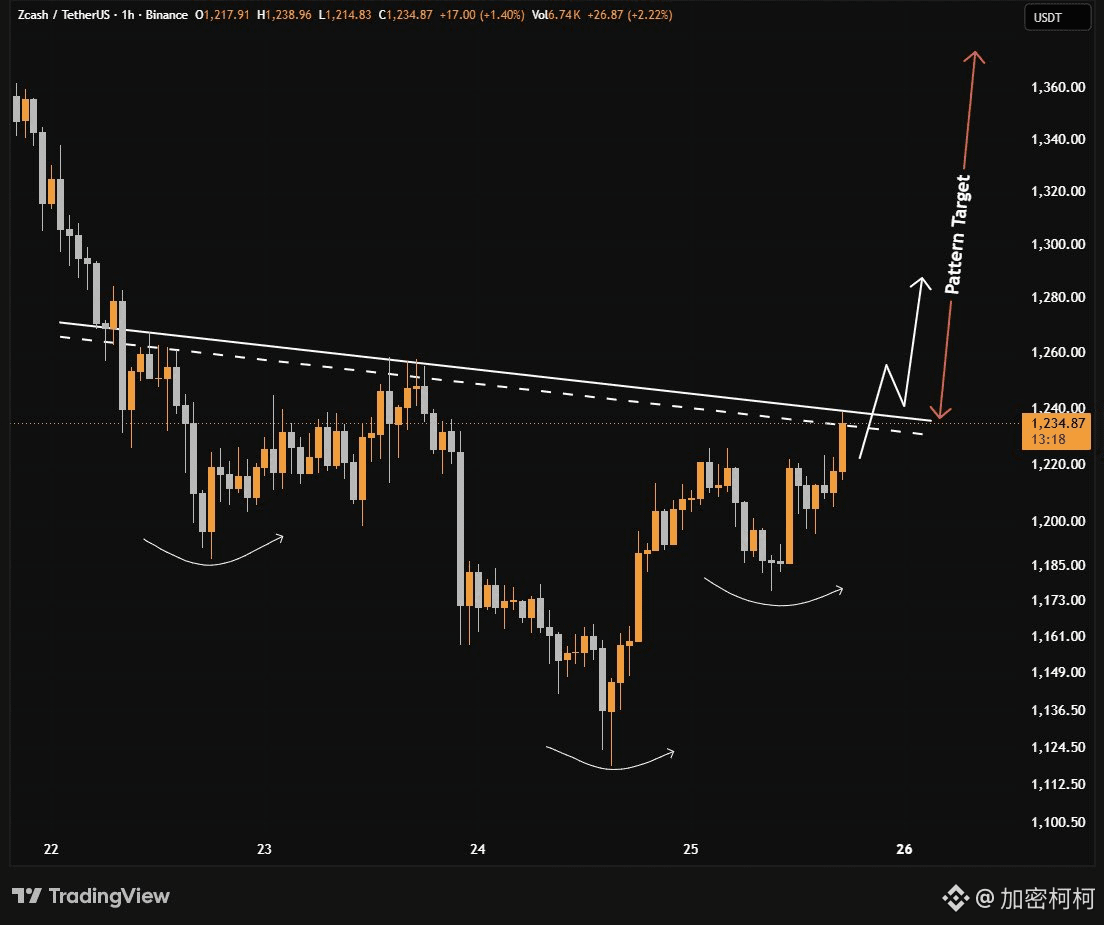
$ZEC This rebound has been fairly strong, and price is now testing resistance around the $1,235–$1,240 neckline. The chart shows signs of a potential inverse head-and-shoulders pattern, but the bulls need to break decisively above this resistance for the pattern to be confirmed.
I’m watching closely to see whether price can hold above $1,240. If it breaks through convincingly, the first target is $1,260, followed by the $1,285–$1,290 area. If the pattern plays out, a measured-move projection puts the target at around $1,370.
On the other hand, if the bears defend this neckline and push the price back down, ZEC will very likely continue to pull back.