The 2-year yield is #美债 4.69%, 81 basis points above the 3.875% median policy rate. The short end isn’t pricing in rate cuts; it’s pricing in rate hikes.
Over the same period, the 30-year yield fell from 5.60% to 5.33%, dropping 27 basis points in ten trading days.
One is pricing in hikes, the other in cuts—two opposing directions in the same bond market.
That’s the real conflict to watch this week.
The data comes from the Treasury’s daily curve for 10-23. Long-duration exposure like $QQQB is what this conflict looks like on the trading screen.
The logic is straightforward. The 30-year yield is the discount-rate anchor for mortgages, corporate bonds, and long-duration stocks. A 27-basis-point drop means all future cash flows are being discounted less.
That’s why the Nasdaq held up better than the Dow. On 10-23, the Nasdaq fell 0.21%, while the Dow fell 1.23%.
A one-percentage-point difference. Weekend futures were basically flat and didn’t reverse the move.
The longer the duration, the more it benefits from this.
There’s another detail that’s easy to miss. The 20-year yield was 5.37%, 4 basis points higher than the 30-year yield.
This section of the long end is inverted. The market is pricing in supply in the 2030s, not growth in the 2050s.
On 10-09, it was 5.65% versus 5.60%, a 5-basis-point difference. The inversion has been there all along; it has just become shallower.
Here’s what comes next. At 2 a.m. on 10-29, the Fed announces its decision; after 4 a.m., Alphabet and Microsoft, the companies behind $GOOGLB , report earnings.
The denominator is set first, and the numerator comes later, with only two hours in between.
If the Fed really hikes, the 2-year yield will jump and the curve will flatten, hitting long-duration assets hardest. If it holds rates steady, then the 27-basis-point drop in the 30-year yield will have been for nothing.
Both directions come at a cost, so the odds don’t justify going all in. The media have reported a 68.9% probability of a December hike; another outlet reported 78%. Those figures don’t line up.
The 3.75%–4.00% policy rate was set by the September 17 hike; the primary source is the Fed’s website.
What I can’t determine is whether this latest drop in the 30-year yield reflects easing inflation expectations or easing supply pressure. The 20-year yield also fell 10 basis points from 10-21 to 10-23. Both explanations fit, but neither can be verified.
The key thing to remember is this structure.
Any strategy that puts “short-end hikes” and “long-end declines” in the same position will be torn apart on decision night.
Because the yield curve isn’t a single sheet of paper; every segment has its own set of accounts.
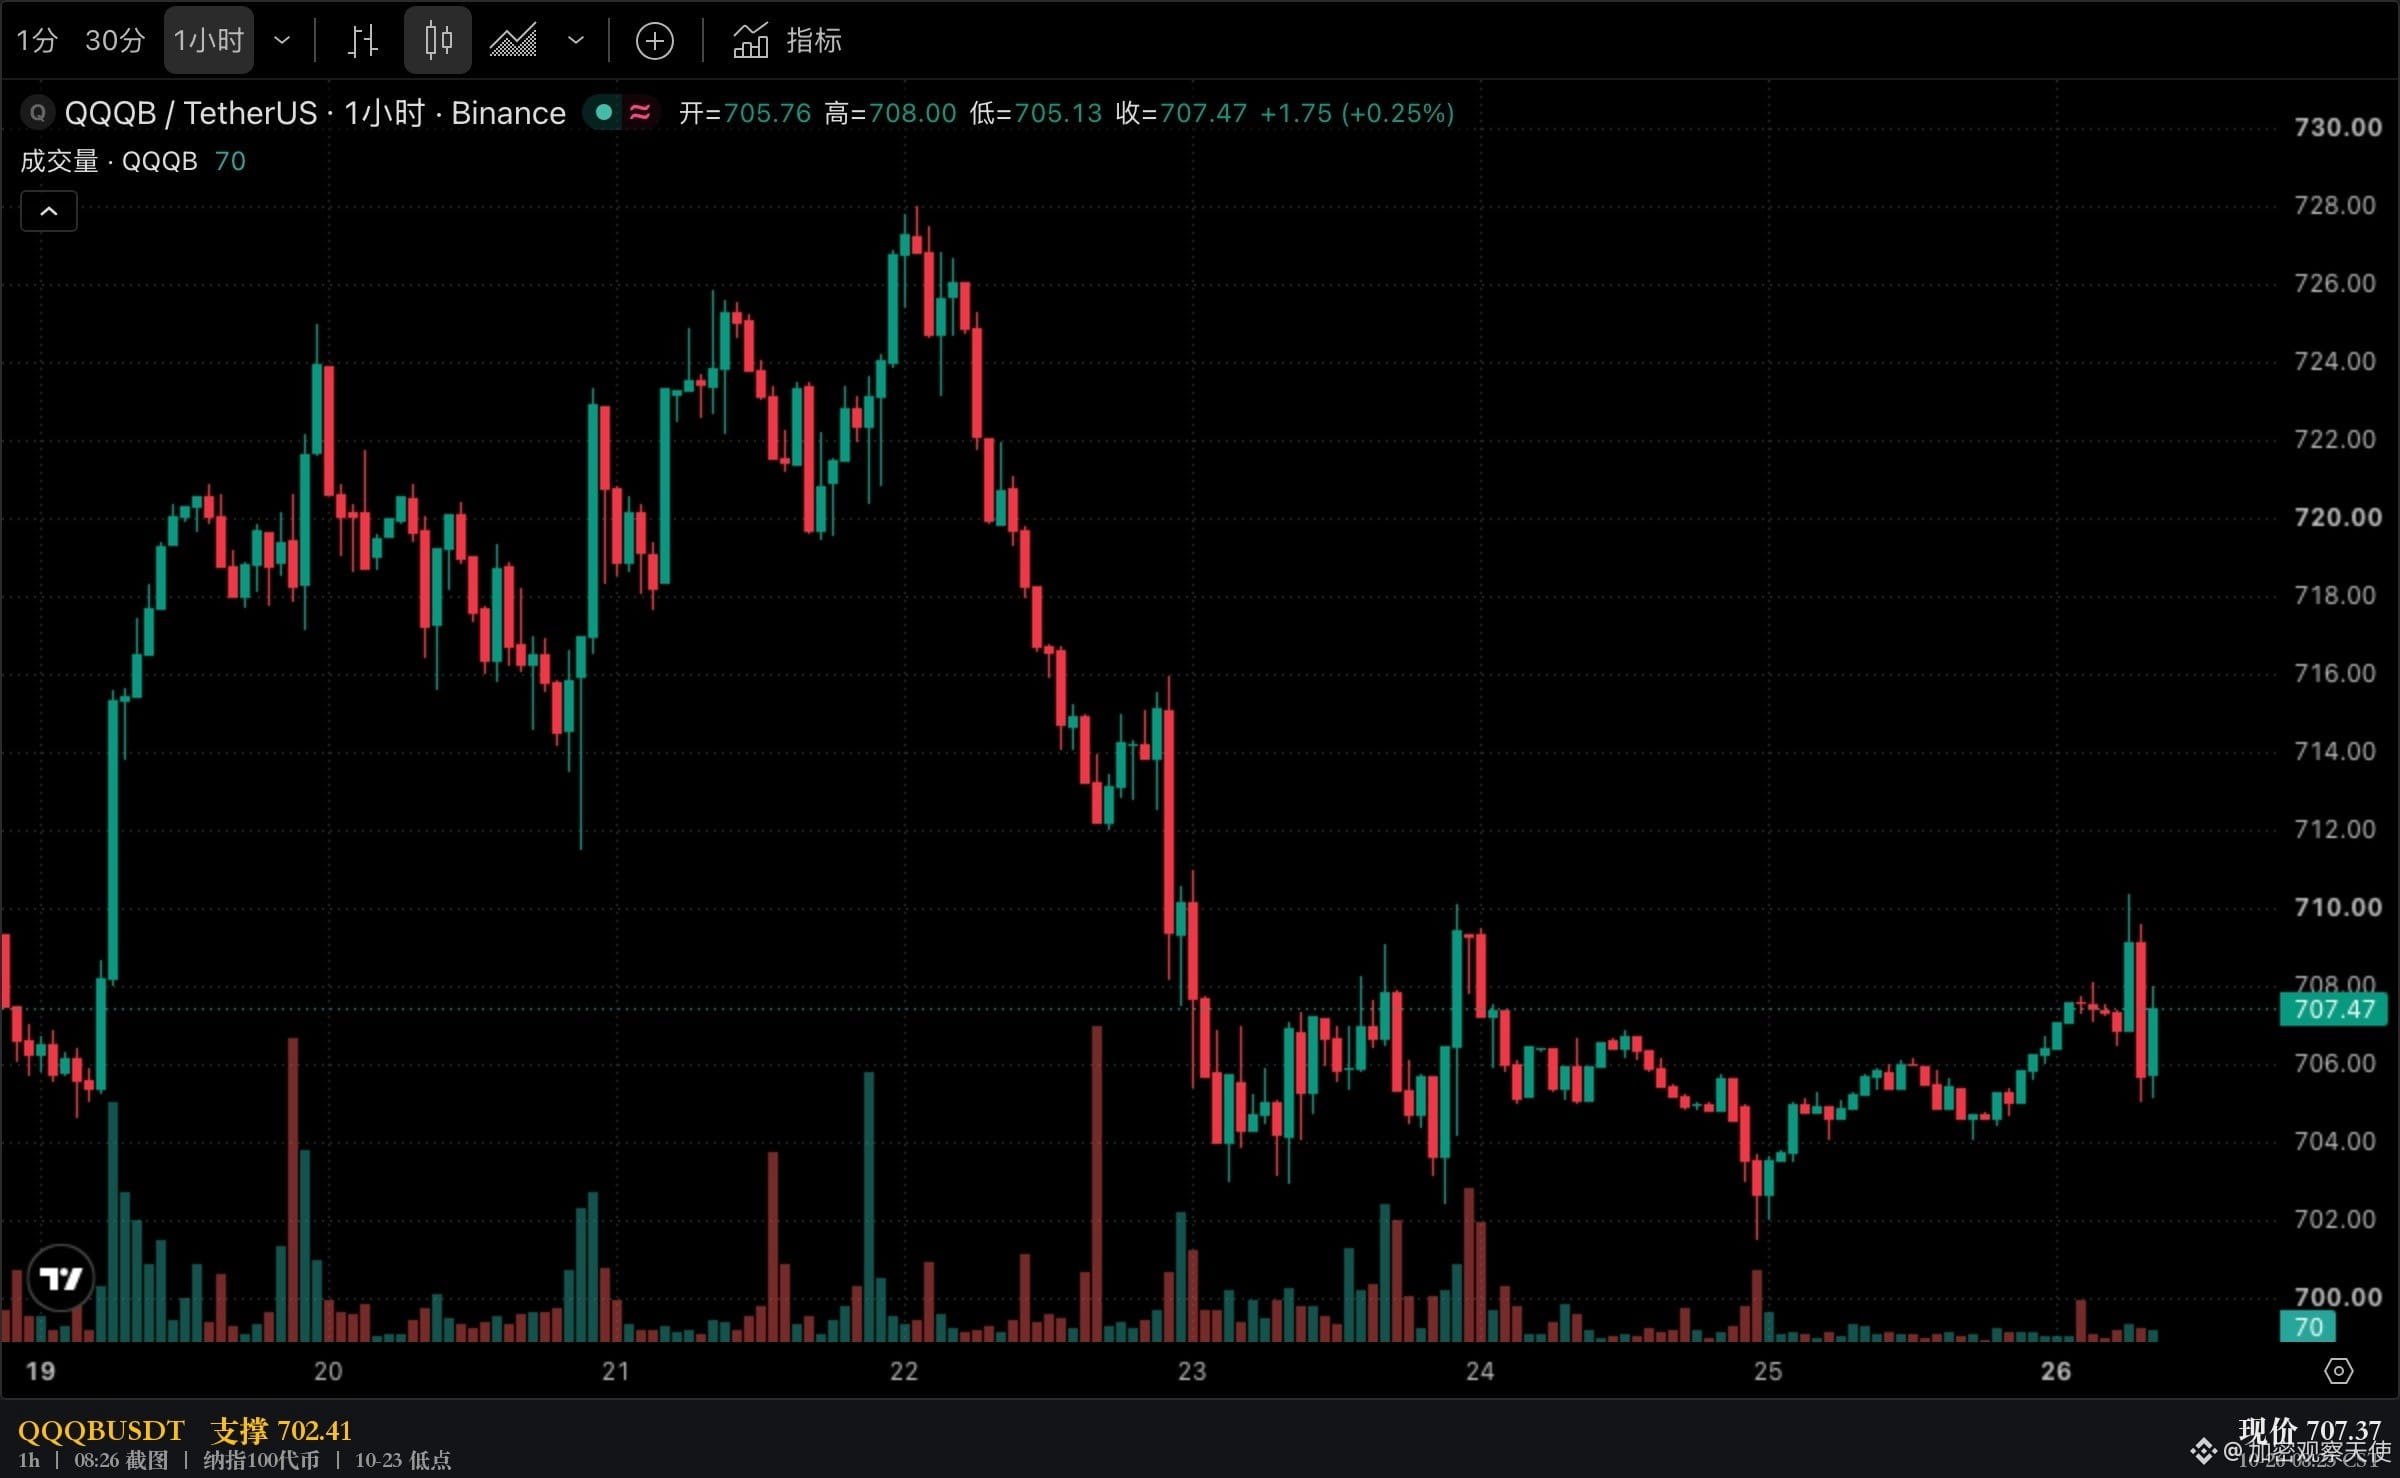
$QQQB closed at 705.98 on 10-23; it will take holding above 702.41 to say that day’s low has been defended.
GOOGLB closed at 321.56 on 10-23; 320.69 is the line to watch ahead of earnings.
U.S. Treasury data is from the Treasury’s daily curve for 10-23; U.S. stock data is from the 10-23 close. The above is structural analysis, not investment advice.