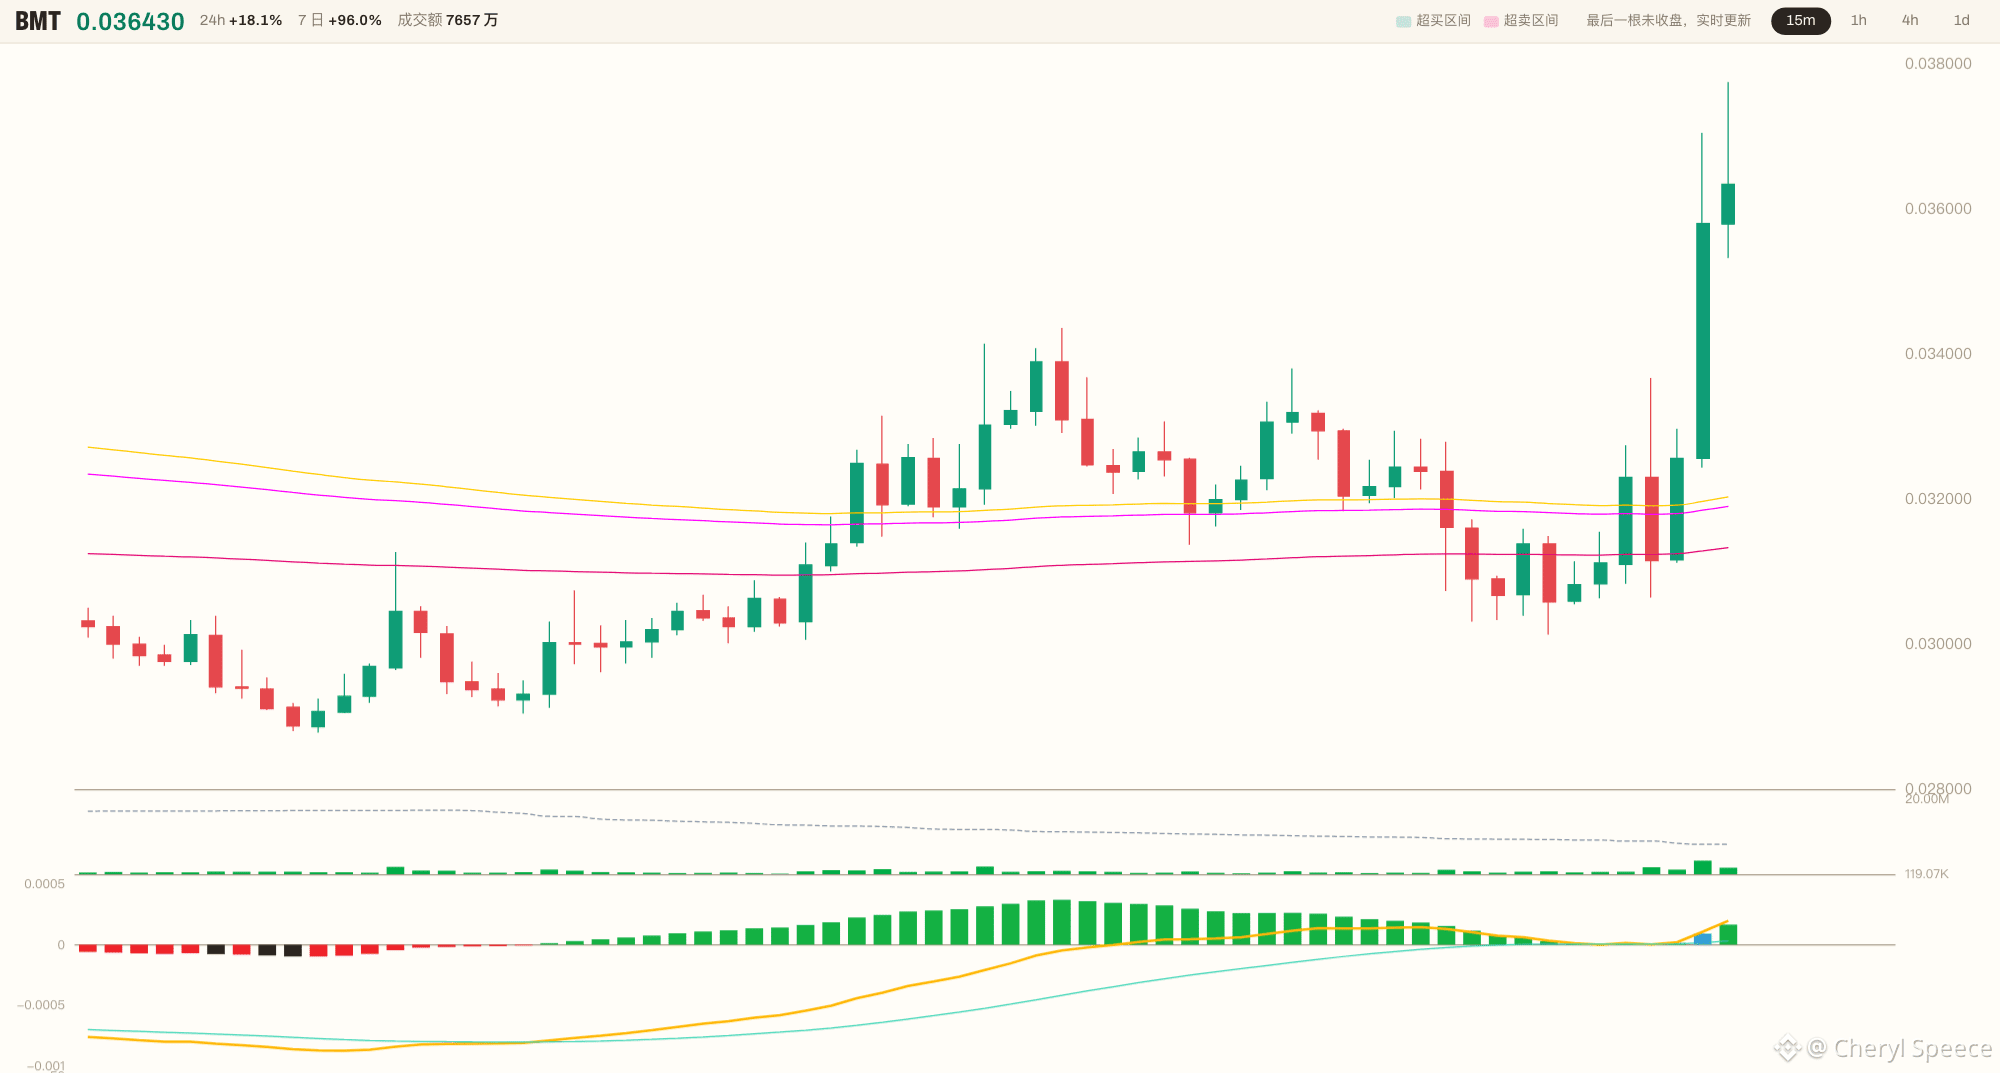
😤 5.7x volume. One 15m candle blew past the previous 12-hour high of 0.034360—and $BMT closed at 0.035800.
🔥 Both the 1h and 4h charts are holding above the moving-average cluster. The direction looks favorable.
😳 But when I checked my checklist, not a single box was fully ticked. CCI is at 290—the only candle in the last 96 to spike above 250—and price is +12.0% above the moving-average cluster. It’s hanging in midair, with very little support underneath.
This isn’t a breakout. It’s reaching out to grab the doorframe.
Jumping in now means being the first to buy into this 5.7x volume spike.
👀 I’m not opening a position. Just watching.
0.035800 is the dividing line—is this the first time the bulls have pushed through the ceiling, or a short-term top after stretching 12% away from the cluster?
I’ll wait for a pullback that holds near the moving-average cluster, then for the 1h chart to stabilize before considering a long. Chasing now means being the first to buy into this volume spike.
Here are the three charts. Are you betting it’ll hold the pullback and climb again, or will this +12.0% stretch get slapped down first? Pick a side in the comments.
#ETH #BTC $ETH $BTC