



From “buyers stepped in” to “sellers can no longer push prices down”: understanding the difference between two tests
The price returned to around the starting point of a large bullish candle, then recovered from its low. Is that enough to keep relying on the original bullish case?
The distinction I learned this time is that buyers stepping in to catch a decline and sellers’ downward pressure having eased are two different things. Old support tells us where to take a closer look; whether to participate depends on what new evidence this pullback brings.
Let’s use the same BTC market data to see the difference clearly. This article uses Binance BTCUSDT USDT-margined perpetual 4-hour candlesticks based on trade prices. All times are UTC+8; prices are in USDT and volume is in BTC. The body shows the range from open to close, and the thin lines show the high and low. Green means the close is at or above the open; reddish brown means the close is below the open. Supply refers to the force of willing sellers, and demand to the force of willing buyers. Total trading volume is not net inflow.
This is a retrospective teaching example: first, review each cutoff using only the price action that had closed by then; then look at what actually happened afterward.
The first pullback: demand stepped in, so why wait?
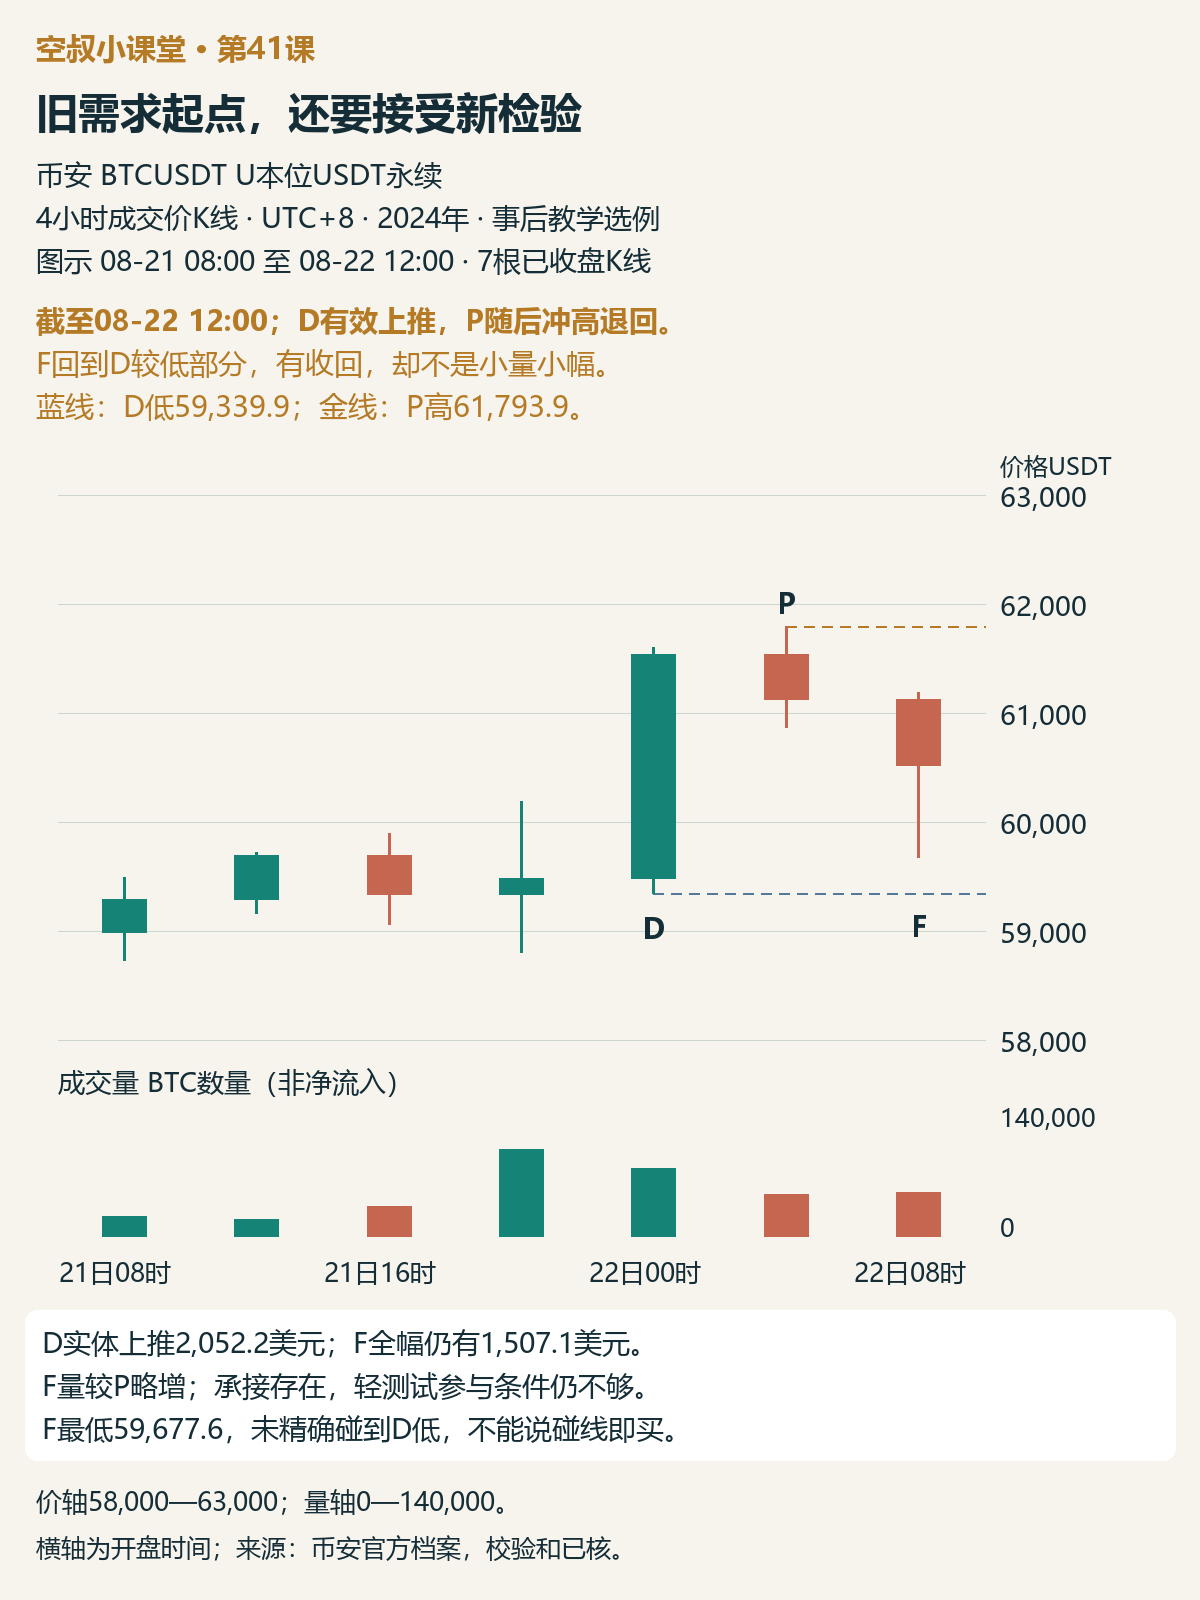
Figure 1 | Through 12:00 on August 22, 2024; 7 four-hour bars. D is a demand-driven advance, P is the subsequent spike and pullback, and F is the recovery after the first clear dip. The blue line marks the low of D, and the gold line marks the high of P
D, at 00:00 on the 22nd, rose from a close of 59,485.9 to 61,538.1, a gain of $2,052.2 in the candle body, on volume of about 69,700 BTC. Its volume was lower than that of the immediately preceding bar, but clearly higher than that of the ordinary fluctuations a few bars to the left, and it came with a substantial upward move. This kind of long bullish bar can be called a demand bar.#BTC
The low of D, 59,339.9, is used as a support reference because effective buying appeared nearby. Support means the area is worth watching for supply and demand if price returns; the advance that happened before cannot guarantee buyers will step in this time.
P then reached 61,793.9 before retreating to 61,120. The next bar, F, reached a low of 59,677.6 and recovered to close at 60,514.9, on volume of about 45,600 BTC.
F did not touch the low of D precisely, but it moved well into the lower part of D's range. Its recovery from the low shows that the downward pressure met resistance. The question is whether this resistance was accompanied by a clear easing of selling pressure. It was not—not yet.
Compared with P, F's volume rose from about 43,300 to 45,600 BTC, while its full high-to-low range widened from $928.7 to $1,507.1. P pulled back from the top, and F then fell sharply; the smooth continuation upward we had hoped for was interrupted. The lower wick tells us buyers appeared at the lows, but volume and range tell us this was still a highly volatile battle between buyers and sellers.
So, as of the cutoff in Figure 1, F showed buying support, but it did not yet meet the criteria for participation based on a low-volume, narrow-range test. I would wait for another test. Specifically, I would watch to see whether the rebound holds and how much lower price can be pushed if supply appears again—not simply wait for a bullish bar, and not assume that every recovery on high volume is untradeable.
The area around the P high is resistance: the previous advance stalled there, so if price approaches it again, we need to check for selling pressure.
The second test: what exactly did T add?
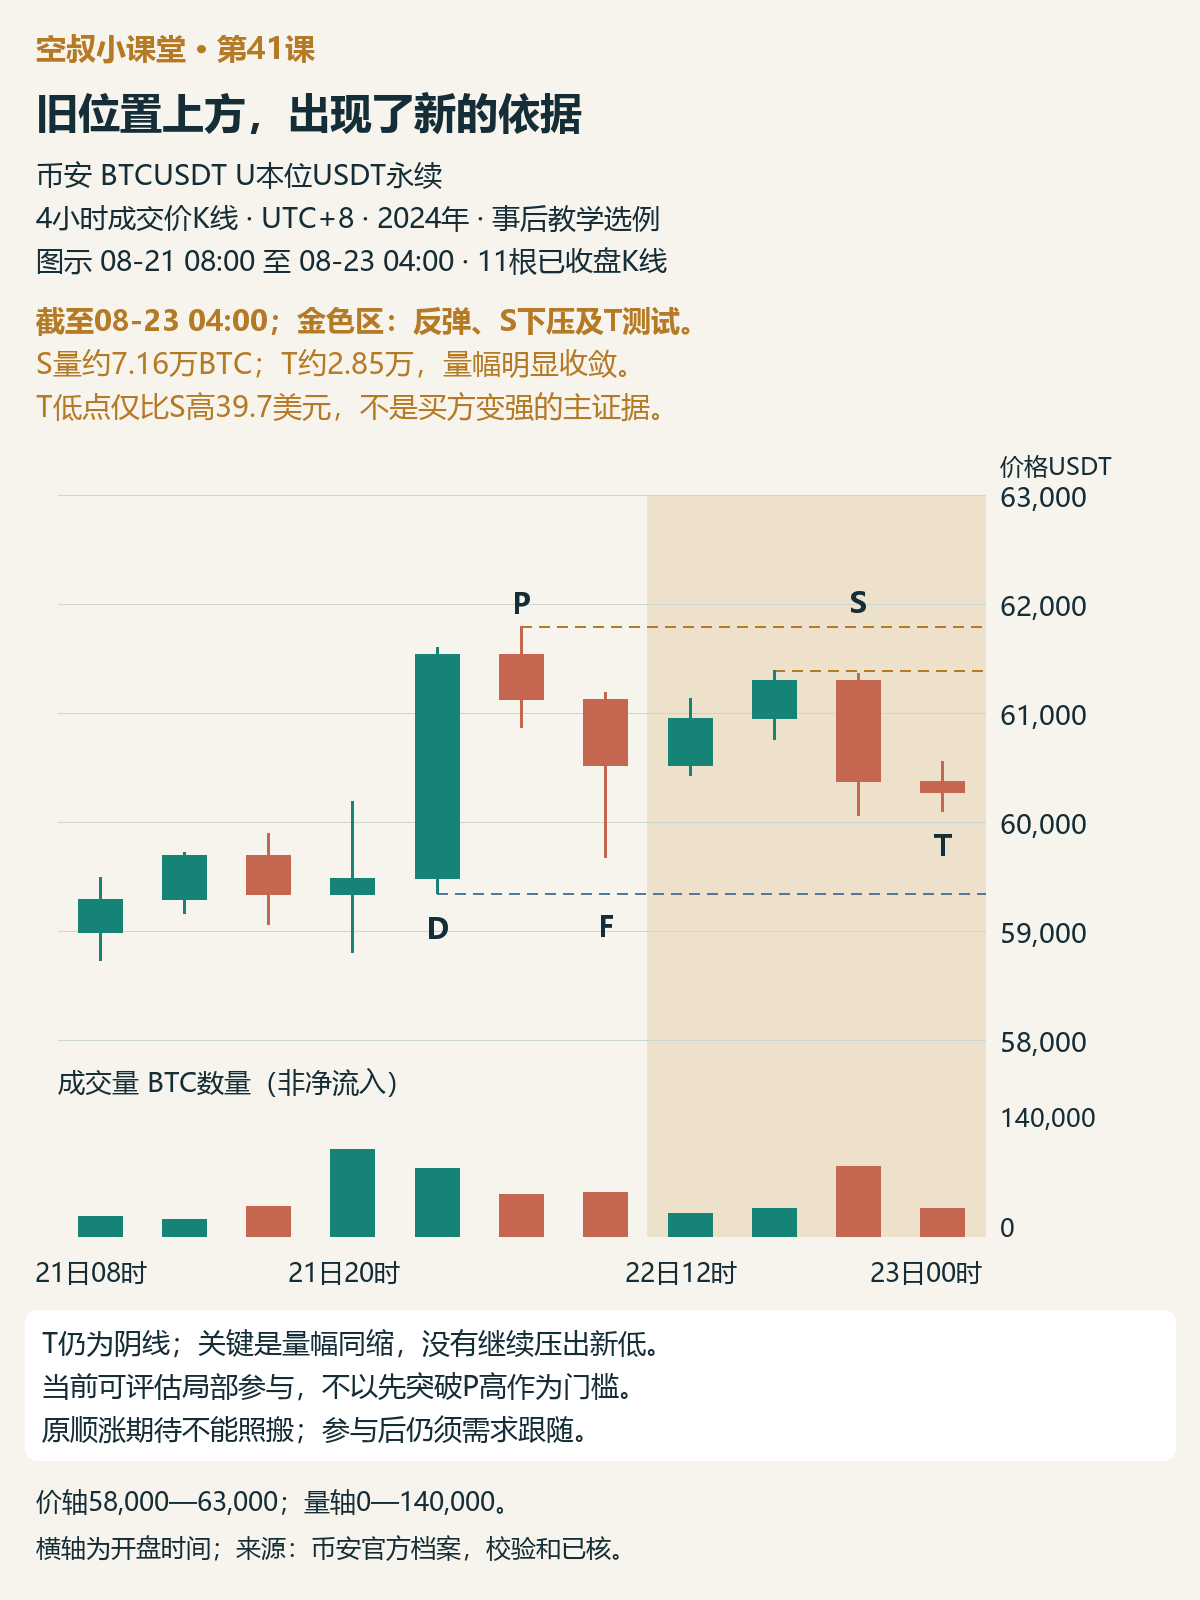
Figure 2 | Through 04:00 on August 23; 11 four-hour bars. After F, price first rebounded; S then pushed down on renewed high volume; T subsequently contracted in both volume and full range, without making a new low. The gold shading marks the newly added price action
The two bars after F lifted the close to 61,297 and the high to 61,392, still below the P high. S, at 20:00 on the 22nd, then pushed price down from 61,296.9 to 60,370.9, with a low of 60,060.3, on volume of about 71,600 BTC.
This step matters: the buying support at F did lead to a rebound, but the rebound did not overcome the top, and S showed that supply was still active. So we cannot treat the rebound after F as proof that “the old support has been successfully validated.” What we need to ask now is whether, after this clear downward push at S, sellers can continue to make progress.
T, at 00:00 on the 23rd, provided information that differed from F: volume was about 28,500 BTC, roughly 40% of S's; the full range contracted from $1,303.7 at S to $454.9, about one-third as much. T's low was 60,100, not below S's 60,060.3.
T was still a bearish candle, closing at 60,272.7, slightly below the midpoint of its full range and below S's close. It was not a forceful bullish counterattack. Its low was only $39.7 above S's, and that small difference alone cannot prove buyers had grown stronger.
The main rationale is the combination of three things: clear supply appeared first, volume and price range then contracted together, and the downward move did not make a new low. This weakens the idea that “sellers can keep pushing price down easily” and supports the view that a new local test formed above the old demand area.
A test means returning to the area near where buying or selling pressure previously appeared to check whether that pressure is still present. T does not get a higher rating simply because it came second; it is that, after S, it showed evidence of supply contracting that F had not yet provided.
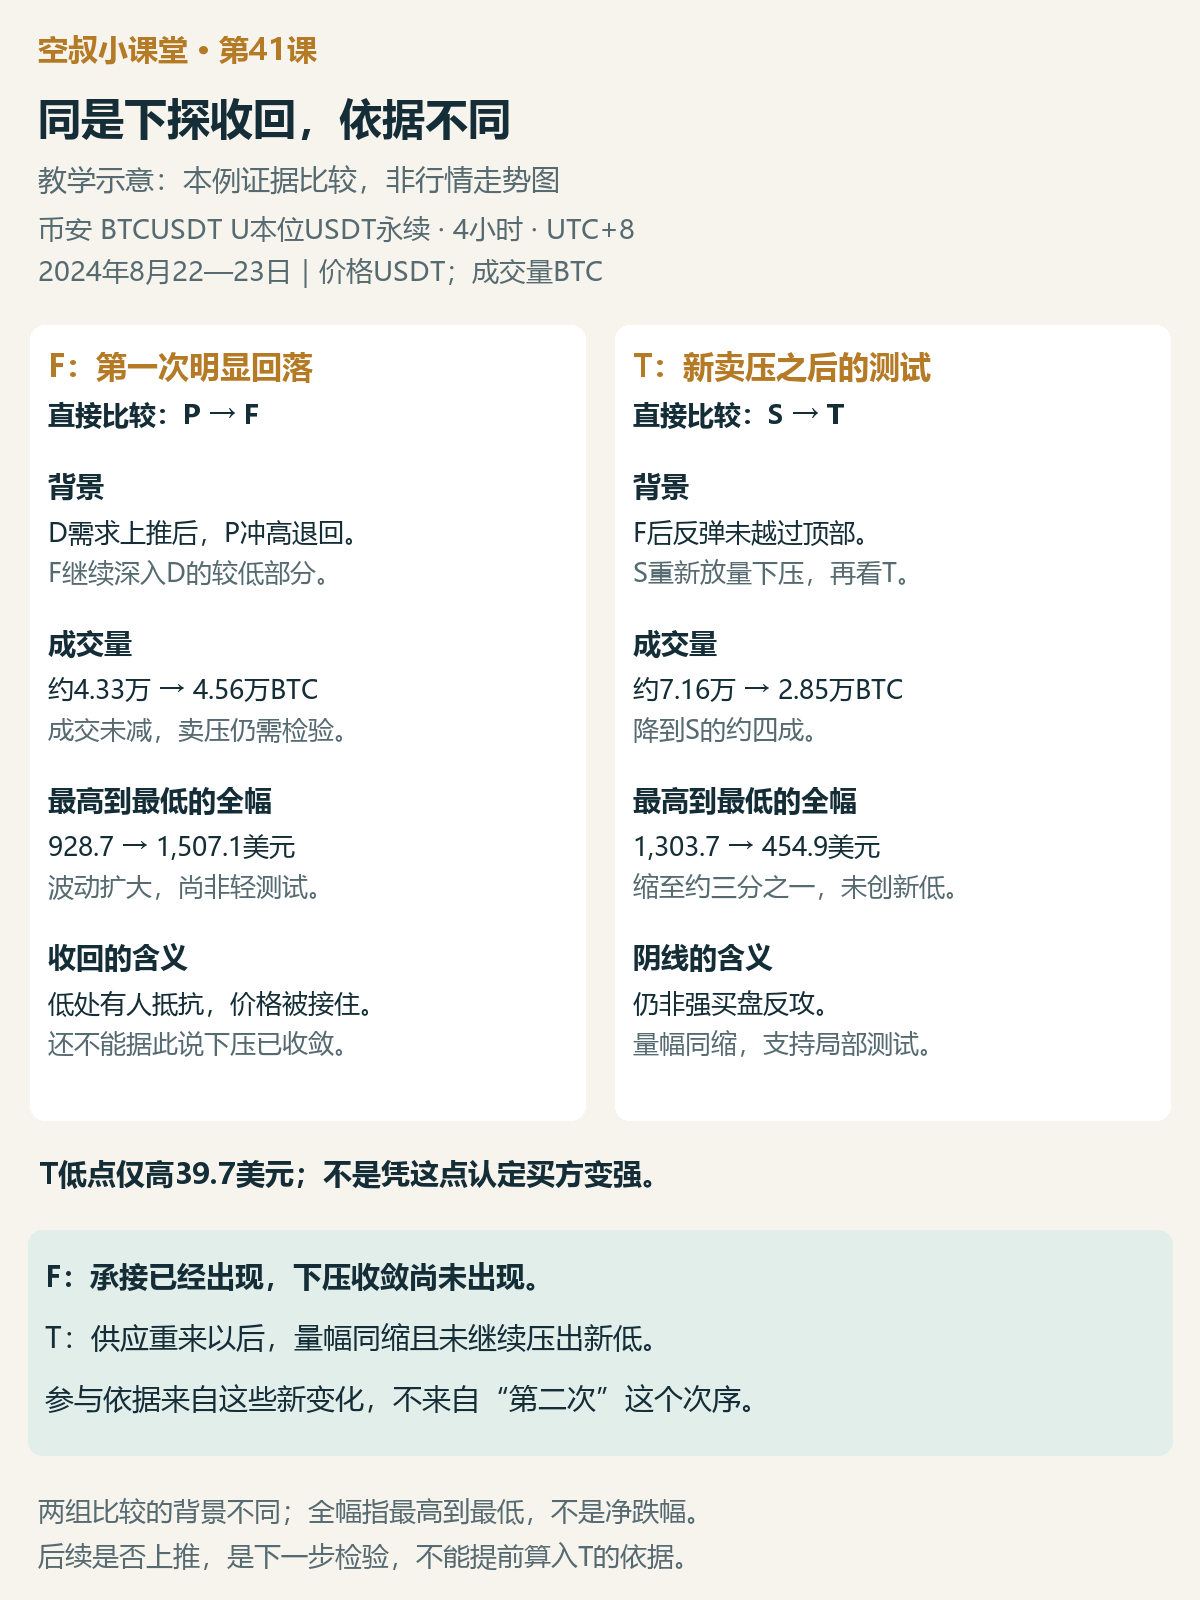
Figure 3 | Educational illustration: evidence comparisons organized using this example's data, not a price chart. F is compared with nearby bar P, while T is compared directly with the new supply bar S. These comparisons address different questions at different stages; participation should not be decided simply by the chronological order of the candles
F and T should not be compared solely by which one closed higher or had the longer lower wick. F's recovery was more pronounced, answering the question, “Was there resistance at the lows?” T did not close strongly, but after a new wave of selling pressure, it answered the question, “Is the downward pressure continuing to expand?” That second question is the key one for assessing participation at this point.
As of Figure 2, I believe there is a new local basis for participation, so a probe long can be considered. The rationale comes from the price-volume changes after S, not from the statement “the old support has not broken.” T held at 60,100; it did not necessarily need to test the D low of 59,339.9. A supply-and-demand shift had already appeared at a higher level, and that is worth watching.
Choosing to participate at a test like T means taking the risk that demand has not truly taken control and may fail to follow through. Waiting for more follow-through gives you more evidence, but you must accept entering at a higher price or missing the opportunity. The reasoning behind either choice should be made clear; it should not be a blanket rule that T only counts if price first breaks above the P high.
After entry, the question is whether demand can take over
T provides evidence that the downward pressure is contracting. What needs to happen next is for price to leave the test area and continue higher, with volume confirming the move. If price tests the area again, we would still expect low volume and a small range.
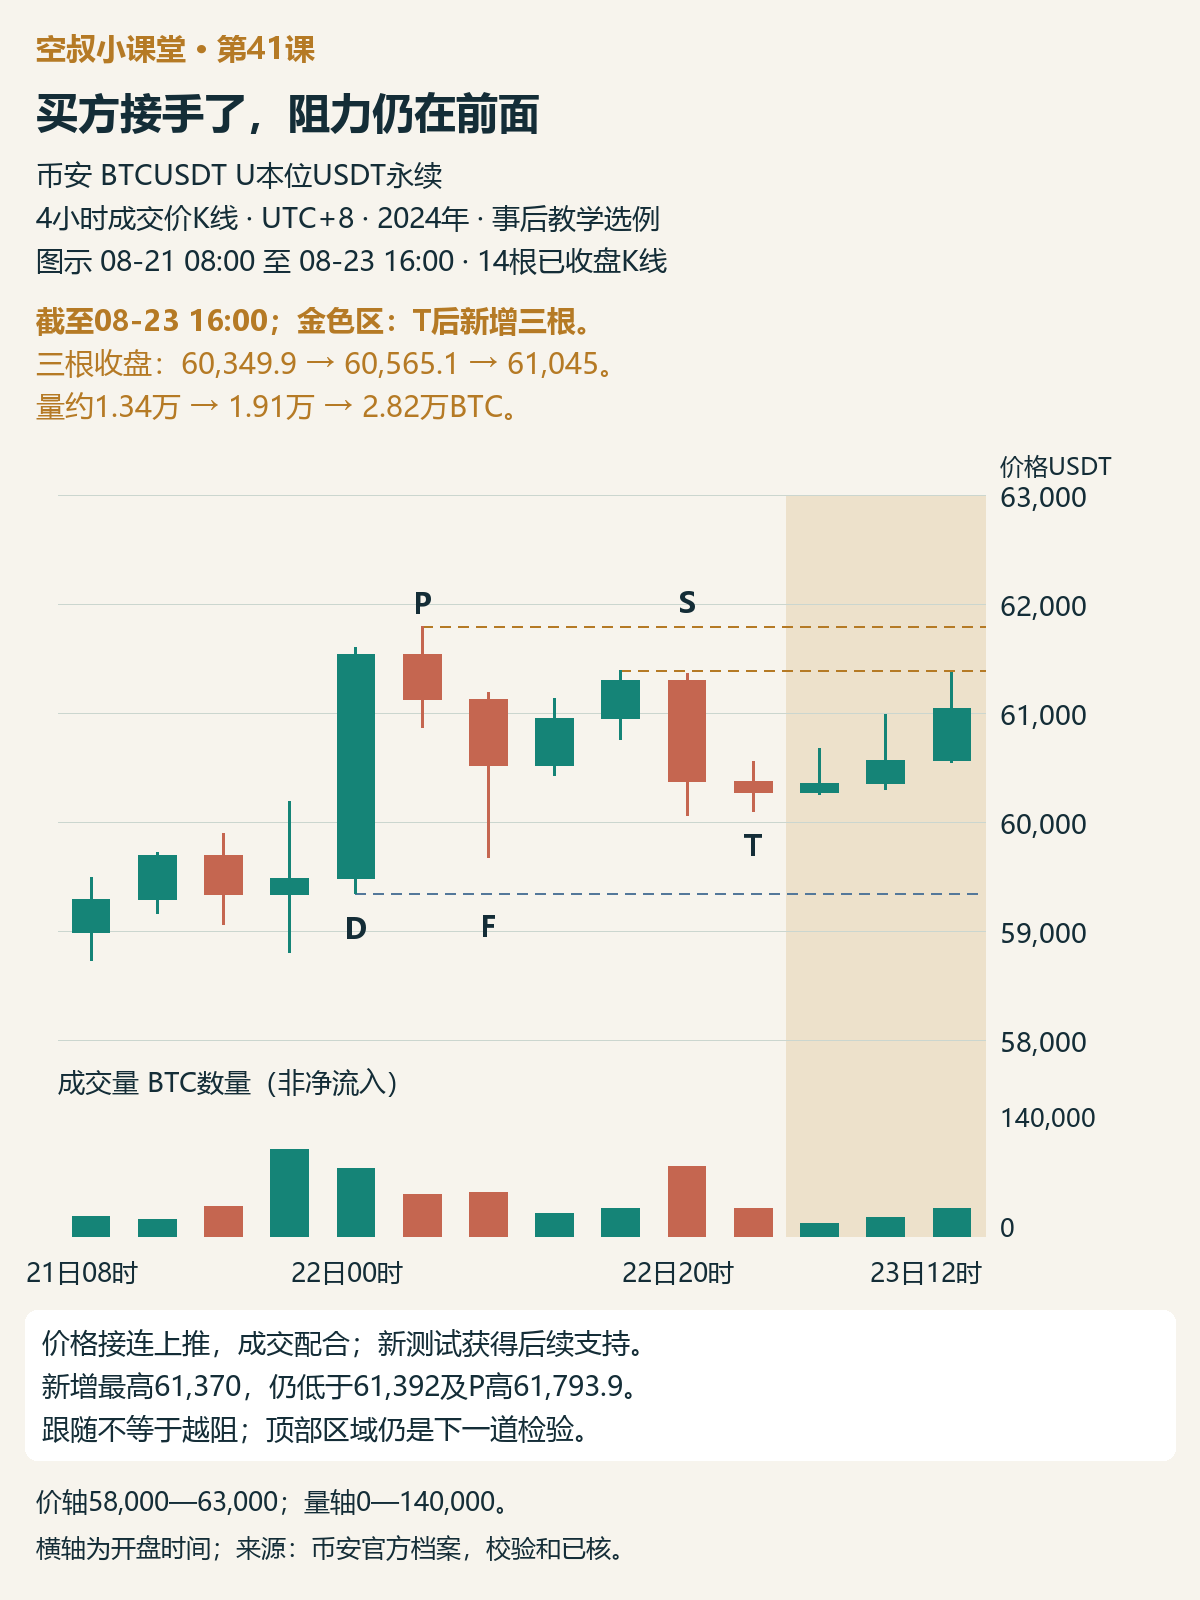
Figure 4 | Through 16:00 on August 23; 14 four-hour bars. The three bars added after T closed progressively higher, with volume increasing on each; the high has not yet overcome the resistance at the top
The three bars after T closed at 60,349.9, 60,565.1, and 61,045, respectively, and their lows also rose progressively. Volume was approximately 13,400, 19,100, and 28,200 BTC, respectively. The first bar did not make much progress, but the next two carried price higher, with volume also increasing.
By Figure 4, demand did indeed take over after T, supporting the local bullish assessment. This evidence emerged after the basis for participation; it cannot be used retroactively to explain why T was actionable at the time.
At the same time, the three added bars reached a high of only 61,370, still below the previous rebound high of 61,392 and well below the P high of 61,793.9. These two highs define an area of resistance to watch. They indicate what the next advance needs to overcome; the fact that demand has followed through does not mean the resistance has disappeared.
Let me also spell out the exit conditions now: if volume expands again and price falls sharply over a wide range, clearly dropping back below the T test low, the basis for the new test is no longer supported. Any position taken on that basis should be exited according to plan, and anyone who has not entered should pass on this opportunity. If a predetermined price stop is triggered sooner, execute it then—do not wait for increased volume or a close, and do not move the stop lower to the D low to delay taking the loss. A stop is an exit condition set before entry to limit losses. This execution reminder is an addition to the series; no price level in the chart is being designated as a universal stop price.
Beyond the top: a separate opportunity
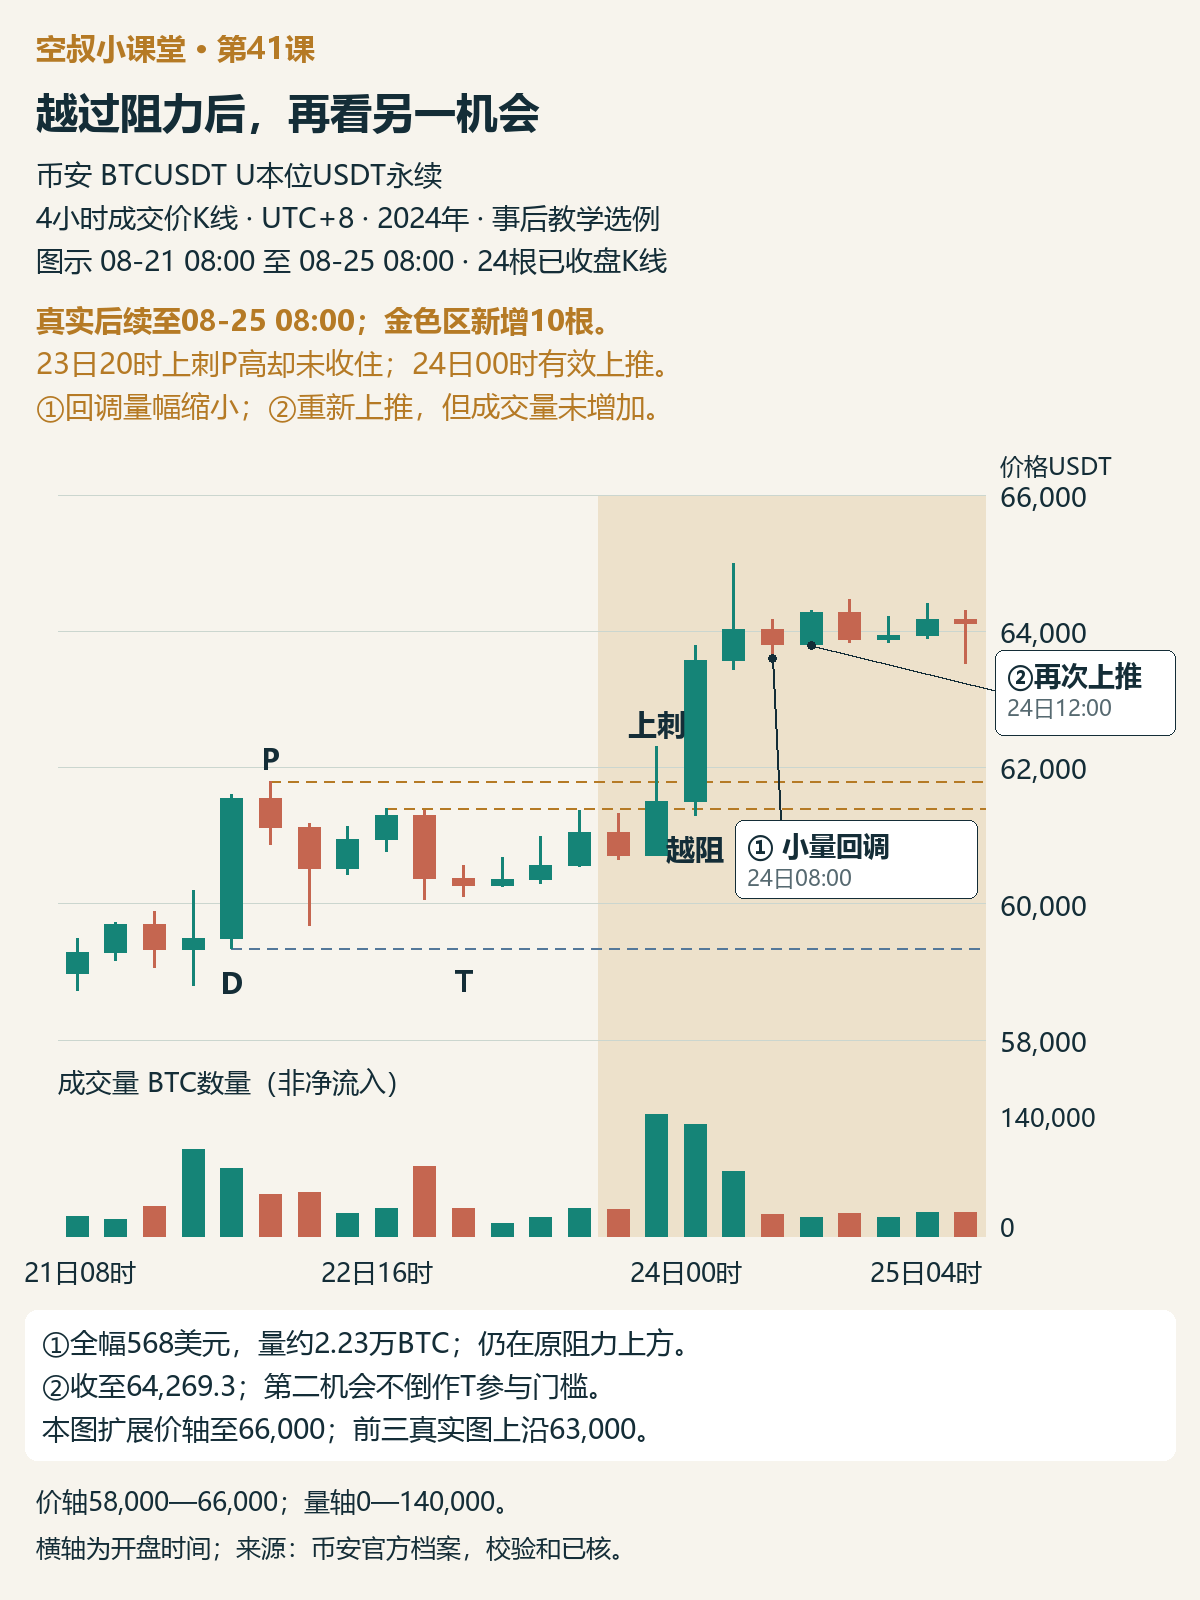
Figure 5 | Actual subsequent price action through 08:00 on August 25; 24 four-hour bars. The gold-shaded area shows the 10 bars added after Figure 4; ① is the pullback at 08:00 on the 24th, and ② is the renewed advance at 12:00 on the 24th. The price axis here runs from 58,000 to 66,000, compared with 58,000 to 63,000 in the earlier actual-price chart; the volume axis is the same
At 20:00 on the 23rd, BTC briefly surged to 62,307.6, but closed back at 61,499, still below the P high. This intrabar spike alone is not enough to say the top was decisively overcome.
It was the next bar, at 00:00 on the 24th, that closed at 63,577.2, accompanied by volume of about 115,200 BTC, decisively clearing the original top. Price continued higher afterward. When demand drives price decisively beyond the original resistance, this can be described as a JOC; a momentary breach by a wick is not enough.
① is the pullback at 08:00 on the 24th. Compared with the preceding advance, its full range contracted from about $1,565 to $568, while volume fell from about 66,700 to 22,300 BTC, roughly one-third as much. The low was 63,600, still above the original resistance area. What contracted was the pullback's volume and range; what held was the position beyond the resistance.
② is the next bar, which closed higher again at 64,269.3. It shows a renewed advance after the pullback, but volume was even lower, so it would be an overstatement to call it another surge in demand.
This is a separate opportunity to assess participation: after a decisive break above resistance, watch whether the pullback is light and whether the breakout holds. The new test at T and the pullback after the breakout are opportunities at two different stages. The later breakout and pullback were not conditions that had to be met in advance at the time of T.
Why can the old level remain relevant while the old rationale must be updated?
Meng Hongtao's case offers a way to think about this. Early in the market, demand responded after supply pushed price down. Repeated tests and advances then gradually established an uptrend. Even when supply appeared along the way, the key was to watch whether the pullbacks grew and whether demand followed afterward. Later, a high-volume demand bar formed support, making it reasonable to expect a low-volume, narrow-range test when price returned to the area.
The top, however, changed the context: price accelerated upward, broke above the upper boundary of the original rising channel, and did so on consecutive increases in volume. When price tried to make another high, the volume over the entire advance was lower than during the prior accelerating move, and supply then pushed price down. The channel's upper and lower boundaries represent the original rhythm of the rise; in this case, breaking above the upper boundary manifested as acceleration. The author interprets this combination as demand waning after a buying climax. The comparison is between the volume of two rising phases, not simply whether one bar had lower volume than the preceding bar.
On the first return to support, volume did not contract, so the old expectation of a light test was not fulfilled. The author nevertheless retained the evidence that the local decline had stalled and that demand subsequently rebounded. After the rebound met supply again, a new secondary test held above support and closed in the middle of its range; the author considered this a possible entry. Only afterward did price rise on increased volume, with the original resistance at the top still the first target. If a JOC then appeared, waiting for a low-volume pullback would offer a second opportunity.
This comparison helps me understand that a weakening context calls for dropping the old rationale, but does not require dismissing every later opportunity. A new opportunity must be established by new evidence. In BTC, F, S, and T illustrate this way of testing the evidence; they do not fully reproduce the author's evidence of a buying climax at the top and should not be given the same label.
This article is an educational analysis based on historical price and volume. It does not document actual orders, returns, or the method's win rate. The author's explanations about CM (his term for smart money) lowering prices, inducing short selling, and trapping the public are supply-and-demand hypotheses; the chart cannot verify institutional identities or positions. The participation decisions in the BTC example are applications made for this article.
My learning summary
The new way of assessing the market I learned in this lesson is to distinguish, at the same old support level, between “price was absorbed” and “a new round of downward pressure has contracted.” F showed resistance to the decline, but volume and range were still large. T came after supply reappeared at S; both volume and range contracted, and price did not make a new low. That provided a different, local basis for participation.
The old level tells us where to look; new evidence supports the current assessment. Subsequent demand follow-through and the resistance overhead then provide separate tests of how far that assessment can carry.
A short exercise
Someone says: “F recovered more clearly from its low, while T was still a bearish candle, so F was the better opportunity to participate in.” What part of the context and which price-volume comparisons does this argument miss? Why could T offer a local basis for participation without counting the rise in Figure 4 or the breakout in Figure 5 as part of the rationale in advance? If the predetermined price stop is triggered first after entry, what should you do?
Feel free to share your reasoning in the comments; don't just answer “up” or “down.” A reference analysis will be added to the comments on this article later.