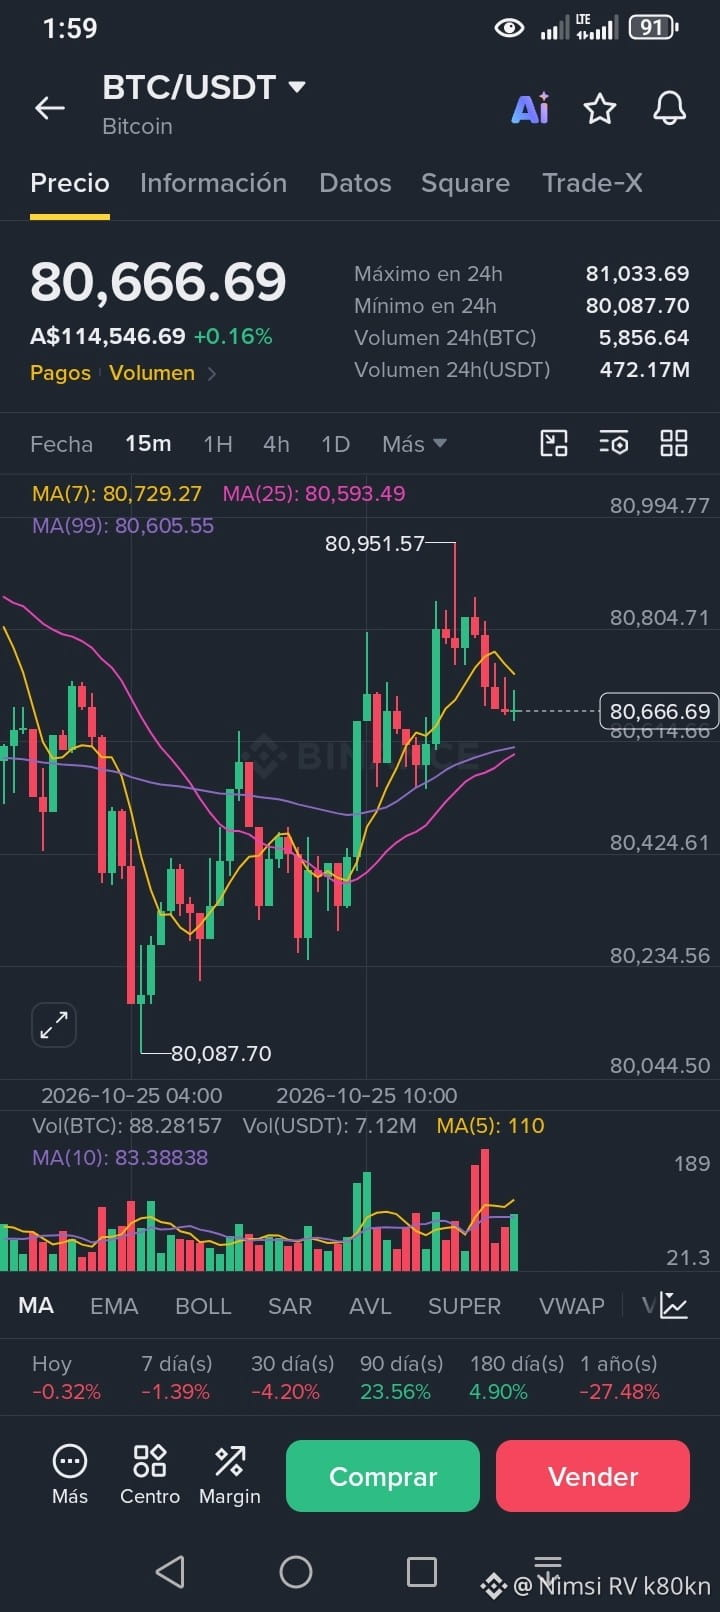
🚨₿ BITCOIN (BTC): THE KING OF CRYPTOCURRENCIES IS HOLDING AT $80,600! 📊🔥
📈 BTC/USDT Technical Analysis | Binance
Bitcoin is trading around $80,666.69, up +0.16% at the time of the snapshot. After reaching an intraday high of $81,033.69, the price is pulling back—a move traders should keep an eye on.
🔎 What does the 15-minute chart tell us?
🟢 Support: $80,600–$80,500. If the price holds above this zone, it could attempt a recovery.
🔴 Resistance: $80,800–$81,000. A breakout on strong volume could open the door to another move higher.
📉 Technical indicators:
- MA(7): $80,729.27
- MA(25): $80,593.49
- MA(99): $80,605.55
The price is below the 7-period moving average, reflecting short-term weakness. However, it remains close to the 25- and 99-period moving averages—a key zone to watch for the market’s reaction.
🎯 SCENARIOS FOR TRADERS
🚀 Bullish scenario: recovery above $80,800 and a confirmed breakout above $81,000 with buying volume.
⚠️ Bearish scenario: a drop below $80,500; the price could seek lower support levels, including the $80,400 and $80,200 zones.
💡 My approach: don’t chase the price. Wait for confirmation of a breakout or bounce, manage risk, and use a stop-loss suited to each trader’s strategy.
₿ Bitcoin is at a decisive short-term level. Will we see another attempt at $81,000 or a deeper correction?
👇 Share your thoughts in the comments!
$BTC
$BNB
$ETH