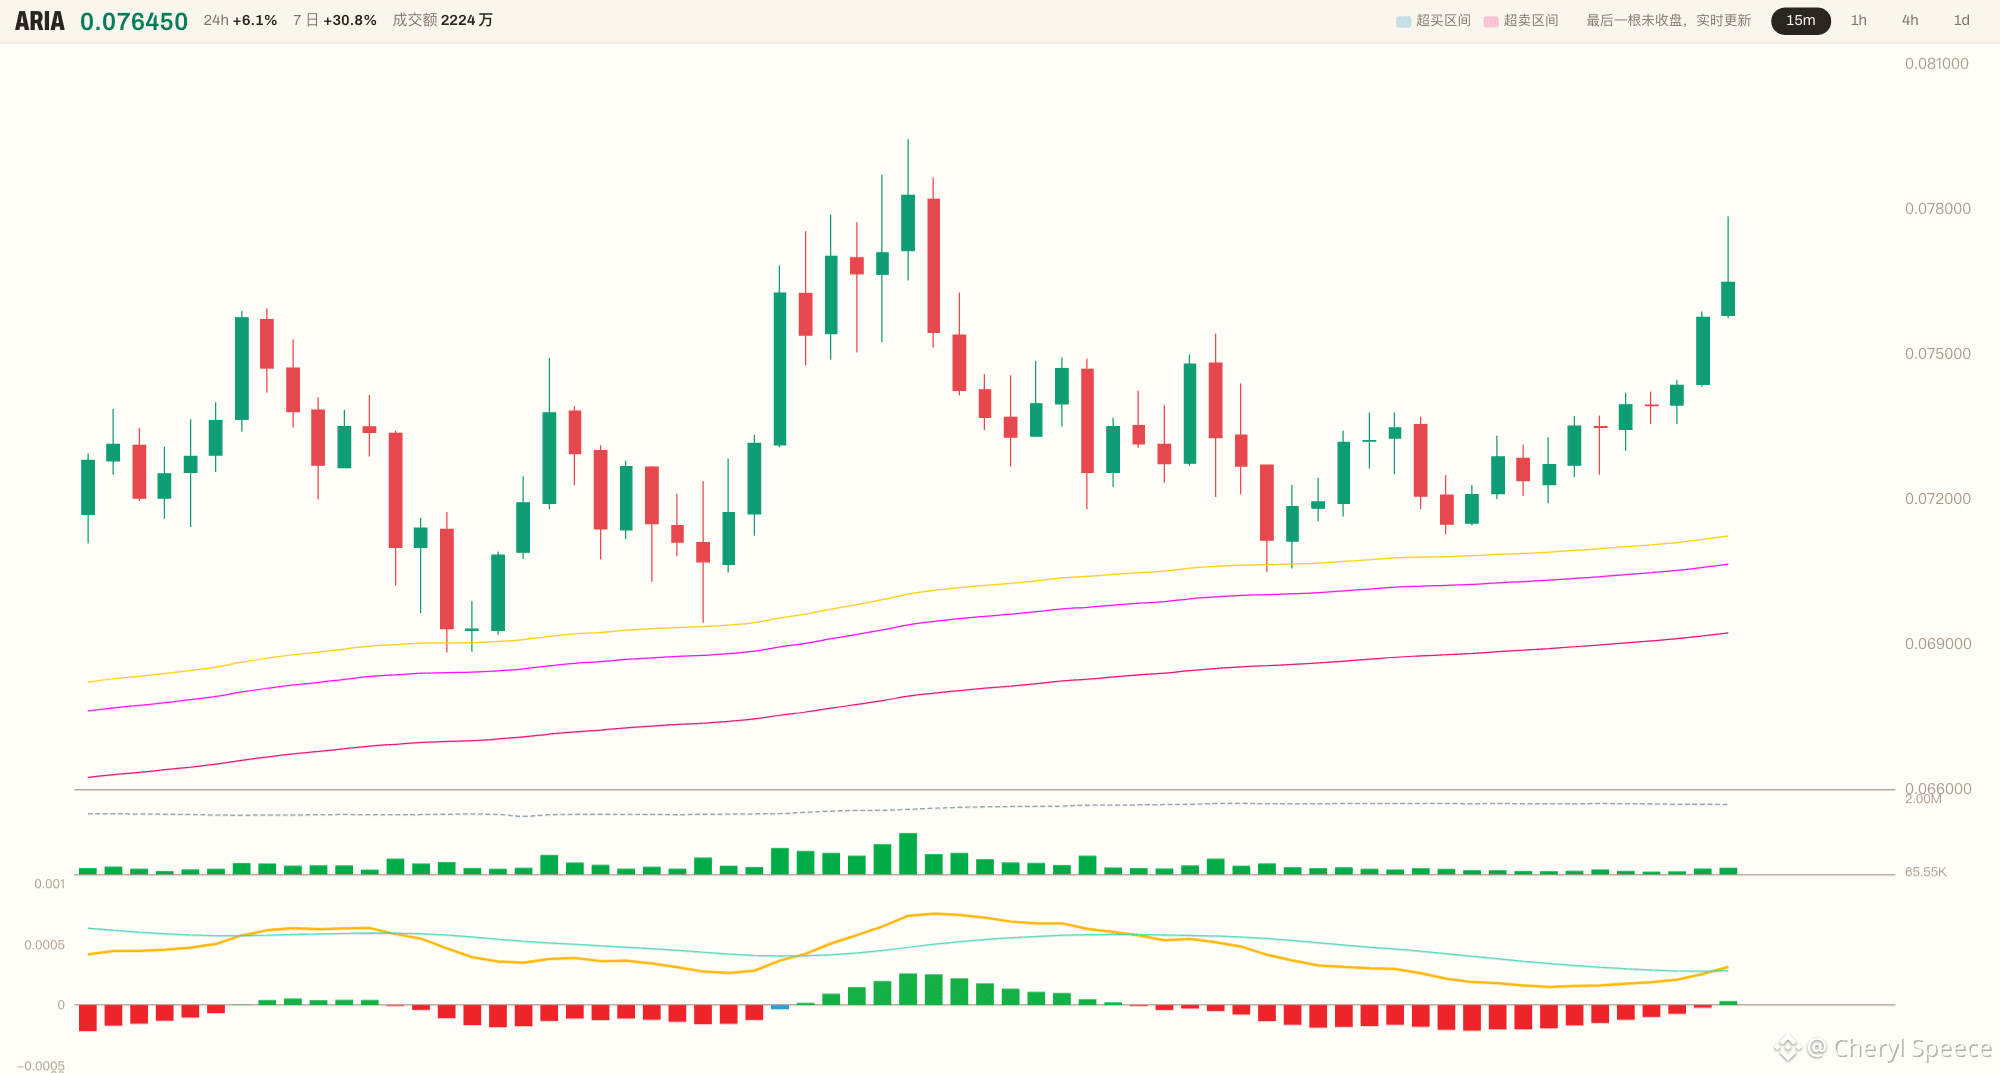
😤 96 candles, 100% bullish alignment, 100% closing above the cluster—and all the way up, $ARIA never gave us a proper pullback.
Current price: 0.075760, already +6.46% above the top of the moving-average cluster at 0.071164.
🔥 Across 5 timeframes, the tally is 17 bullish and 3 bearish. The 1h and 4h are both holding above the cluster. There’s no question about the direction.
😳 But look down at your feet—the price is already suspended in midair, 6.5% above the cluster. This is an overheated zone, not a starting line. BTC and ETH are both bearish, so the door for altcoin longs is firmly shut. The 1d is still just in a bearish rebound.
Reaching in now means carrying the last baton for these 96 bullish candles.
👀 I’m not chasing. I’ll wait.
Here’s what I’m waiting for: a pullback to around 0.071164, the top of the moving-average cluster, and signs of support before considering a long on the rebound. 0.075760 is the dividing line—is this where a mature uptrend catches its breath before pushing higher, or will it turn back down after an overheated surge?
Here are the three charts. Are you betting on a pullback to 0.071164 holding before price moves up again, or is this 6.46% deviation the short-term top? Pick a side in the comments.
#ETH #BTC $ETH $BTC