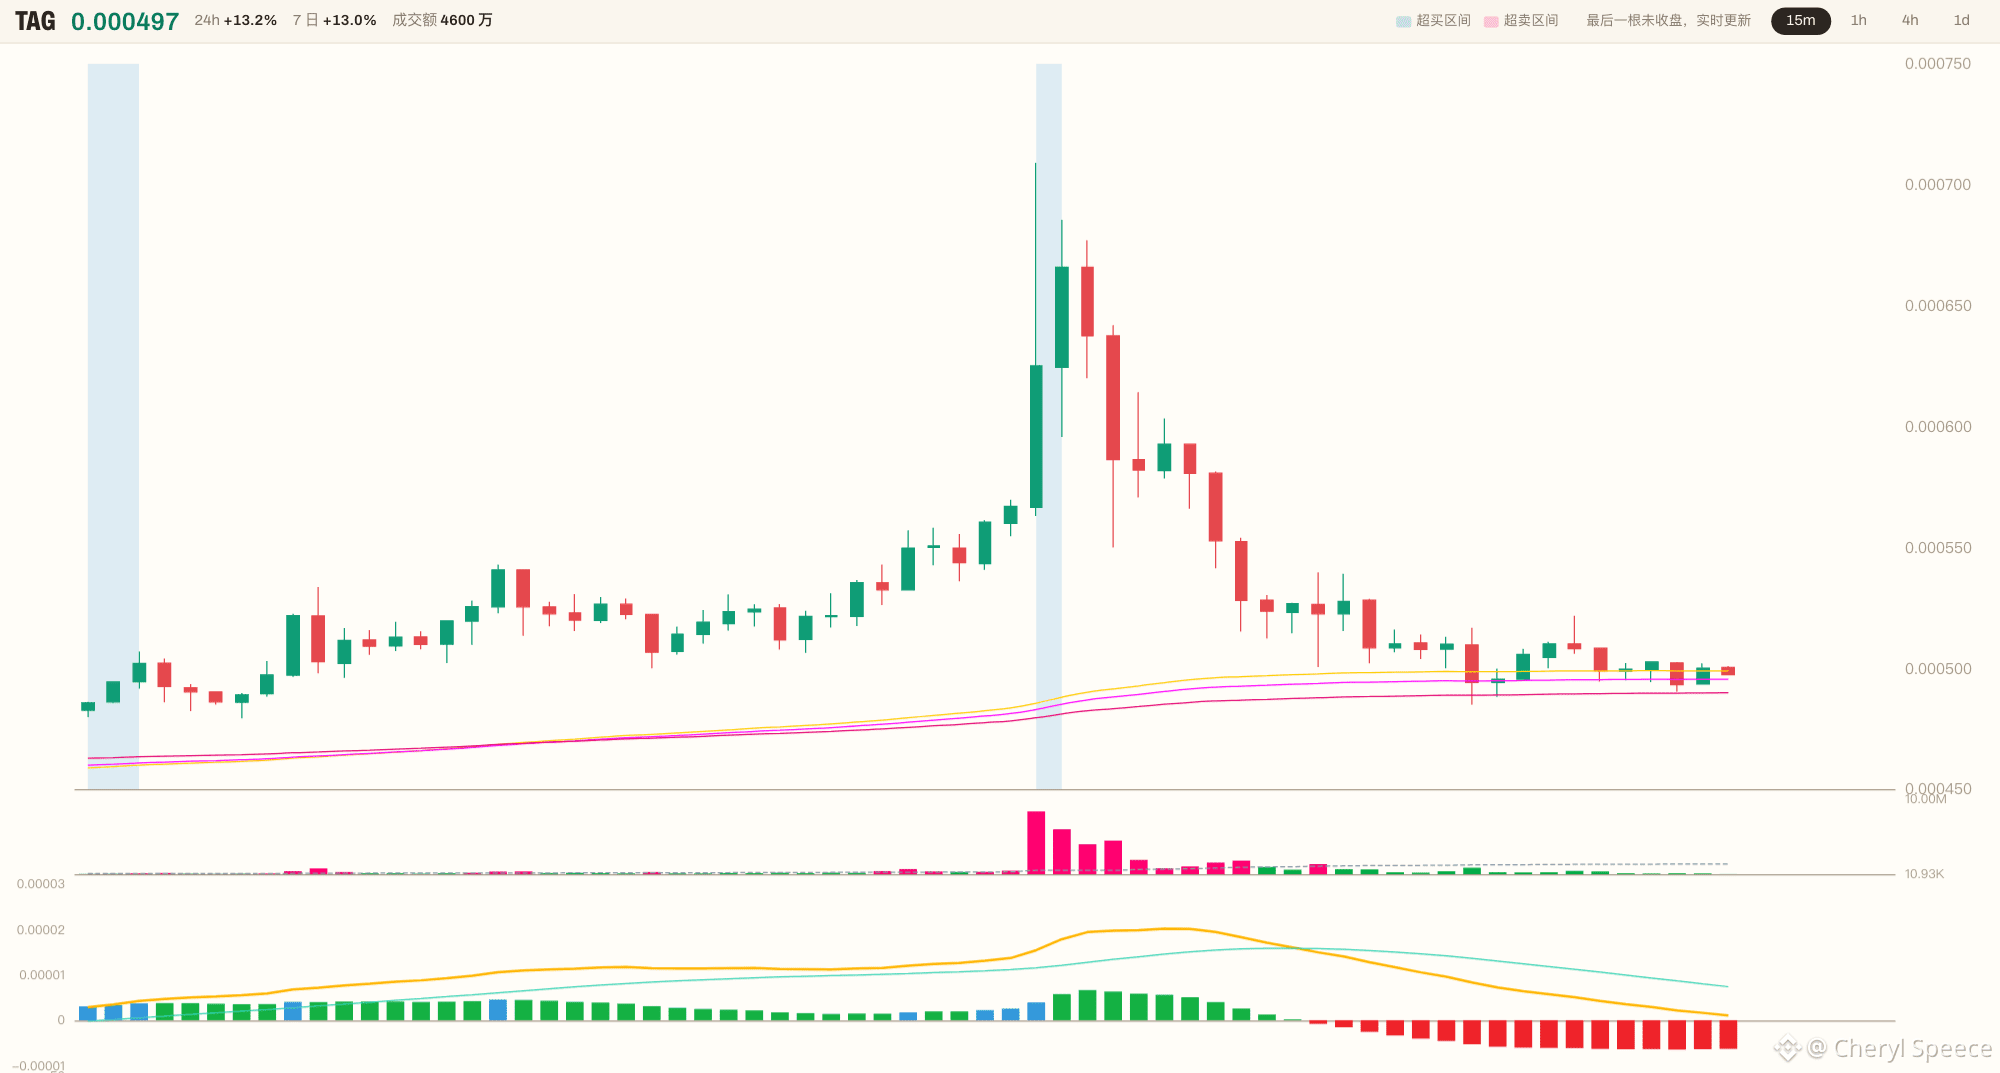
😤 423x volume. One candle blasted straight through the highs of the previous 48 candles at 0.0007—and TAG closed at 0.000500, just +0.22% above the cluster.
Volume kicked the door open. Buyers only managed to get one foot inside.
🔥 Don’t rush to call a reversal. Look up: price is +36.42% above the moving-average cluster, already hanging in midair; RSI is 81.2 and CCI is 335—overbought and scorching hot. Only 3 of 7 conditions are lit. The bearish alignment still accounts for 47%; the 1h chart is in a bearish rebound, while the 4h chart is still crouched below the cluster.
😳 Reaching in now means catching the last baton after that 423x volume spike; shorting here means running into a freshly lit bullish candle. Neither side looks clean.
👀 I’m not opening a position. I’ll wait.
I’ll wait for a pullback that holds above the top of the moving-average cluster, around 0.000499, and for the 1h chart to stabilize before considering a long. 0.000500 is the dividing line—is this the first genuine breakout after a long bearish stretch, or will it just brush the top of the cluster and lose its nerve?
Three charts are right here. Are you betting it holds 0.000499 on the pullback and climbs again, or is this massive-volume candle the short-term top? Pick a side in the comments.
#ETH #BTC $ETH $BTC