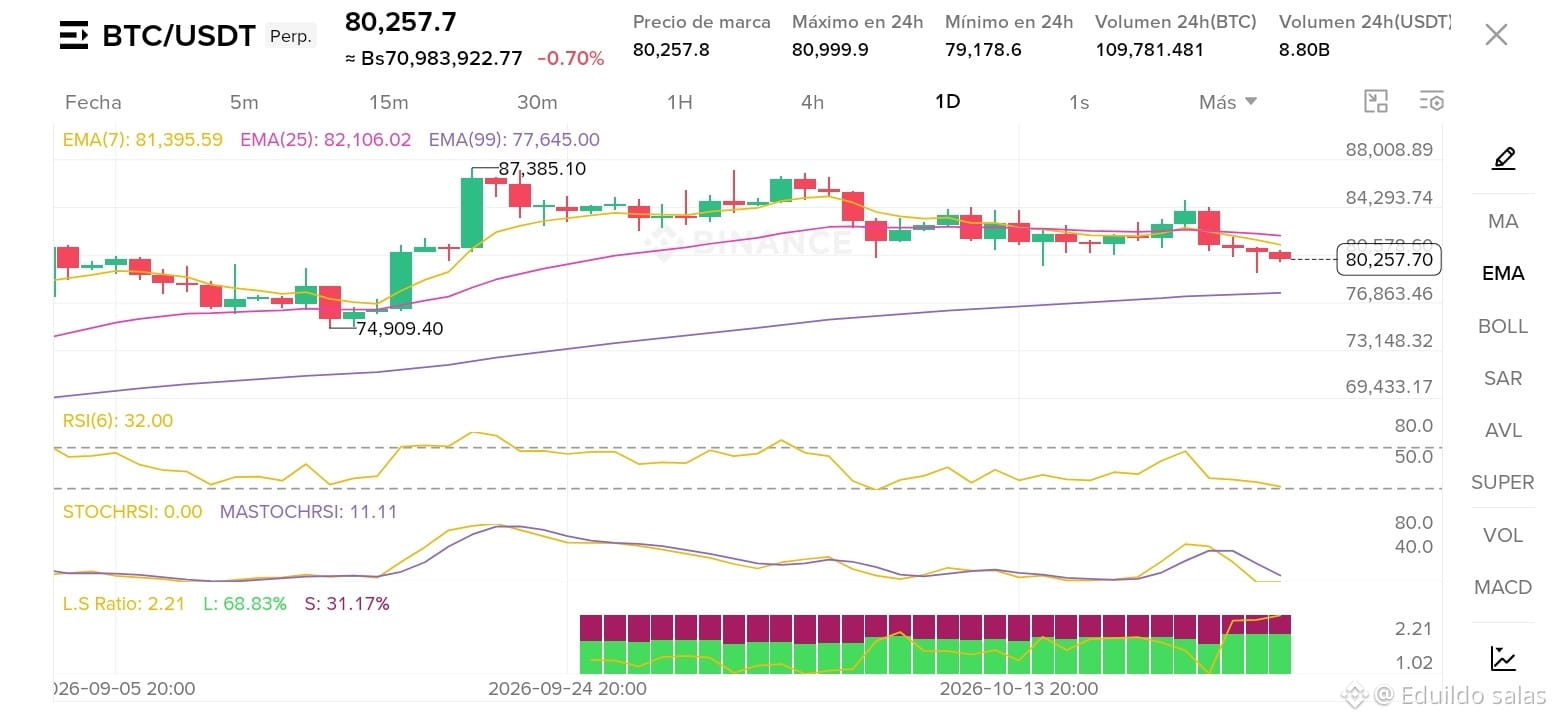
📉 Technical Analysis of $BTC /USDT: Key Support Zone or Prelude to a Bounce? ⚡
Bitcoin’s ($BTC ) price action on the daily timeframe (1D) presents a scenario traders should watch closely:
Current price: Around $80,257.7, down slightly in recent hours (-0.70%), with a 24-hour range between $79,178.6 and $80,999.9.
Moving Averages (EMA): The price is testing the EMA(7) zone (around $81,395) and the EMA(25), while the EMA(99) continues to mark the broader structure lower at $77,645, serving as a critical structural dynamic support level.
Momentum Indicators (RSI & StochRSI): The RSI(6) is at 32.00, approaching oversold territory, suggesting selling pressure may be fading or nearing levels that could attract buyers. Meanwhile, the StochRSI is showing low readings (0.00 / 11.11), reflecting compression as it seeks a potential turning point or bullish relief.
Market Sentiment (L/S Ratio): The Long/Short ratio stands at 2.21, with 68.83% of positions long and 31.17% short, showing that most of the market is maintaining a bullish stance and anticipating a bounce.
💡 What should you watch now? We’re at a very interesting technical inflection zone. If buyers successfully defend the current support and the RSI turns upward, we could see a quick recovery push. Otherwise, keep a close eye on the strength of lower support levels.
How do you see price moving over the next few hours? Do you think this level will hold, or will we go looking for liquidity lower down? I’d love to hear your thoughts in the comments! 👇
#BTC #Bitcoin #BinanceSquare #EarningsSeason #BinancePick