📊 $AKE / USDT: Calm before a new surge on the daily chart? 🚀
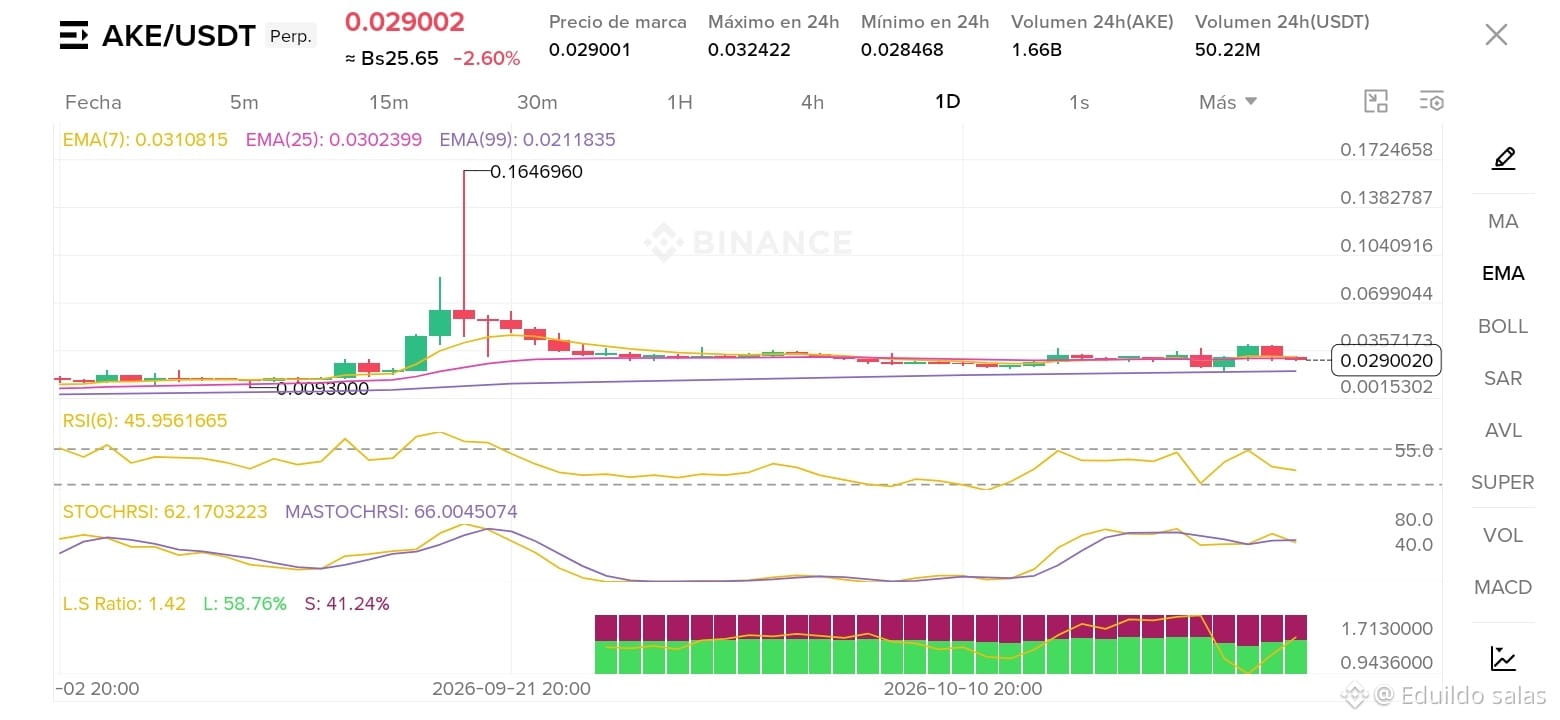
The $AKE pair on the daily timeframe (1D) is showing us a very interesting setup following the powerful upward move that took it to a high of 0.16469. The price is currently trading at 0.02900 USDT, consolidating in a narrow range after the correction.
What are the key indicators telling us right now? 🧐
1️⃣ Moving Average Structure (EMAs): The EMAs are compressed near the current price action (EMA(7) at 0.03108, EMA(25) at 0.03023, and EMA(99) at 0.02118). This technical compression often precedes explosive volatility as the price prepares to break out of its accumulation range.
2️⃣ Strength and Momentum (RSI and StochRSI):
The RSI(6) is at a neutral 45.95, reflecting a temporary balance between buyers and sellers with no signs of extreme oversold conditions, leaving room to move in either direction.
The StochRSI remains stable in the mid-to-upper range (62.17), suggesting that the previous momentum is stabilizing.
3️⃣ Market Sentiment (Long/Short Ratio): The position ratio shows an L/S Ratio of 1.42, with 58.76% Longs versus 41.24% Shorts. This indicates that institutional and retail sentiment remains predominantly bullish in the medium term.
💡 Conclusion and Outlook: $AKE is maintaining a clear support structure after digesting the initial euphoria. Closely monitoring volume behavior and a confirmed breakout above the short-term moving averages could give us the first clues about the next directional move.
⚠️ Remember to always manage your risk and do your own research (DYOR). This is not financial advice.
#AKE #BinanceSquare #EarningsSeason #BinancePick #USQ3GDPAndSeptemberPCEDueNextWeek