

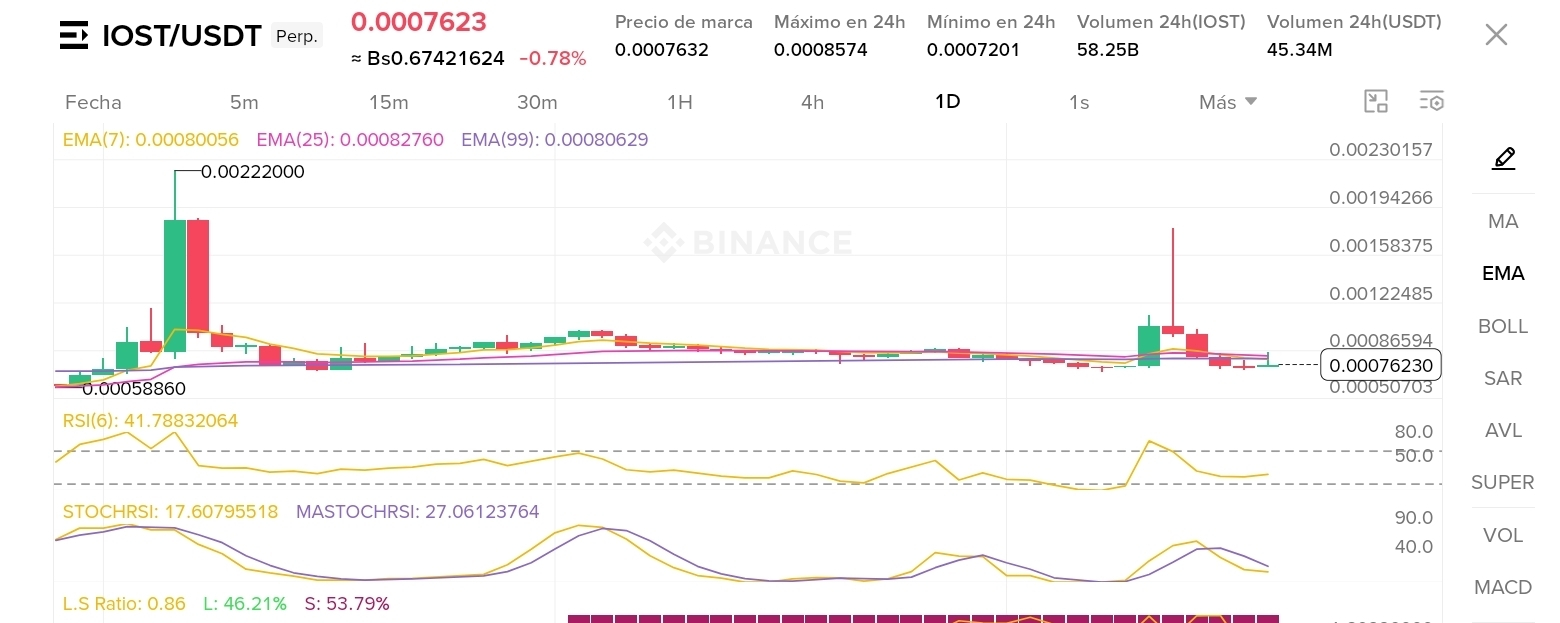

🚨 Technical Analysis of $IOST /USDT: Time to accumulate or a prelude to a technical bounce? 📊📉
Greetings to the entire Binance Square community. Today, we’re going to take a detailed look at the behavior of the $IOST /USDT pair on the daily timeframe (1D), assessing key price levels, moving averages, and oscillators to understand what we can expect in the short and medium term.
🔍 Chart Breakdown (1D Timeframe)
Current price: Trading around $0.0007623 USDT, holding in a compression and sideways phase following the previous impulsive moves (let’s remember the peak reached at $0.0022200).
Moving Averages (EMA):
The EMA(7), EMA(25), and EMA(99) lines are tightly intertwined and flat just above the current price (approximately between $0.00080 and $0.00082). This reflects a clear consolidation zone where the market is deciding its next directional move.
Momentum Indicators (RSI & StochRSI):
RSI (6): At 41.78, remaining in a low-neutral zone. This indicates an absence of significant buying pressure, but there is enough room to move upward without becoming overbought.
StochRSI: At 17.60 (with %K and %D in low compression zones). These levels suggest that selling pressure has eased considerably, increasing the likelihood of a technical reversal or a short-term bullish relief rally.
Market Sentiment (Long/Short Ratio):
The position ratio stands at 0.86, with 46.21% Longs versus 53.79% Shorts. This shows that bearish sentiment has a slight edge in open positions, which could trigger a short squeeze if the price surprises the market with a sudden upward move.
🎯 Key Levels to Watch
Critical support: The recent lows around $0.0005886 – $0.0005070. Staying above these levels is vital to preserving the current base structure.
Immediate resistance: The EMA cluster and the $0.000800 – $0.000865 zone. Breaking above this range with buying volume would open the way to higher targets.
💡 Conclusion and Strategy
The chart shows an extremely compressed asset, making it ideal for close monitoring on a watchlist. Low volatility on daily charts often precedes explosive moves. As always, risk management is the golden rule: trade with a cool head, use stop-loss orders, and adapt your strategy to your risk profile (spot or futures).
What do you think of IOST's current setup? Do you see an imminent rebound, or would you rather wait for confirmation? Let me know in the comments! 👇
#IOST #BinanceSquare #CryptoTrading #TechnicalAnalysis #Altcoins #TradingDeFuturos