
🚀 Live Technical Analysis: What Does the Daily Chart for $BTW /USDT (Perpetual) Tell Us? 📊
Price action for the $BTW /USDT pair is at a highly interesting point that has traders on Binance Square paying close attention. Let’s break down the key points shown on this daily (1D) chart:
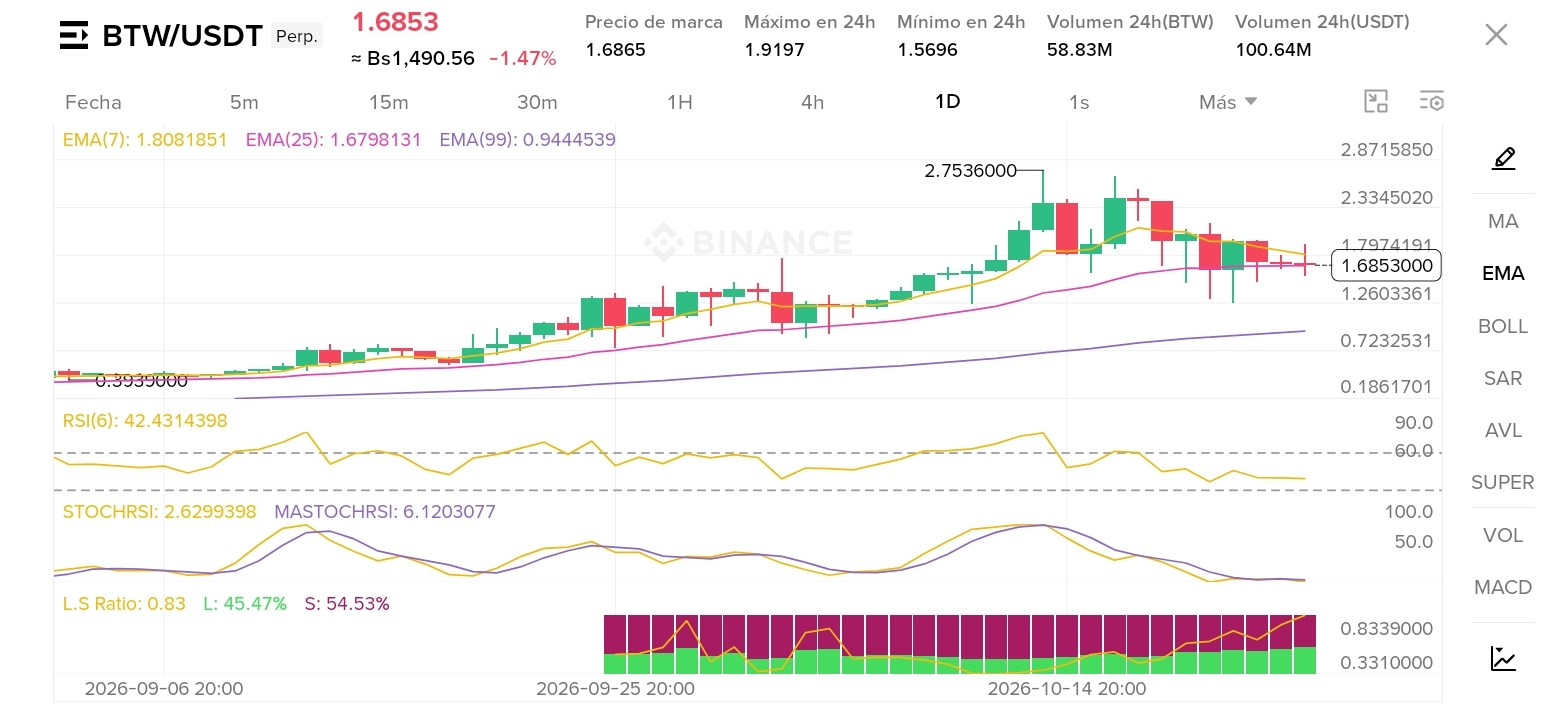
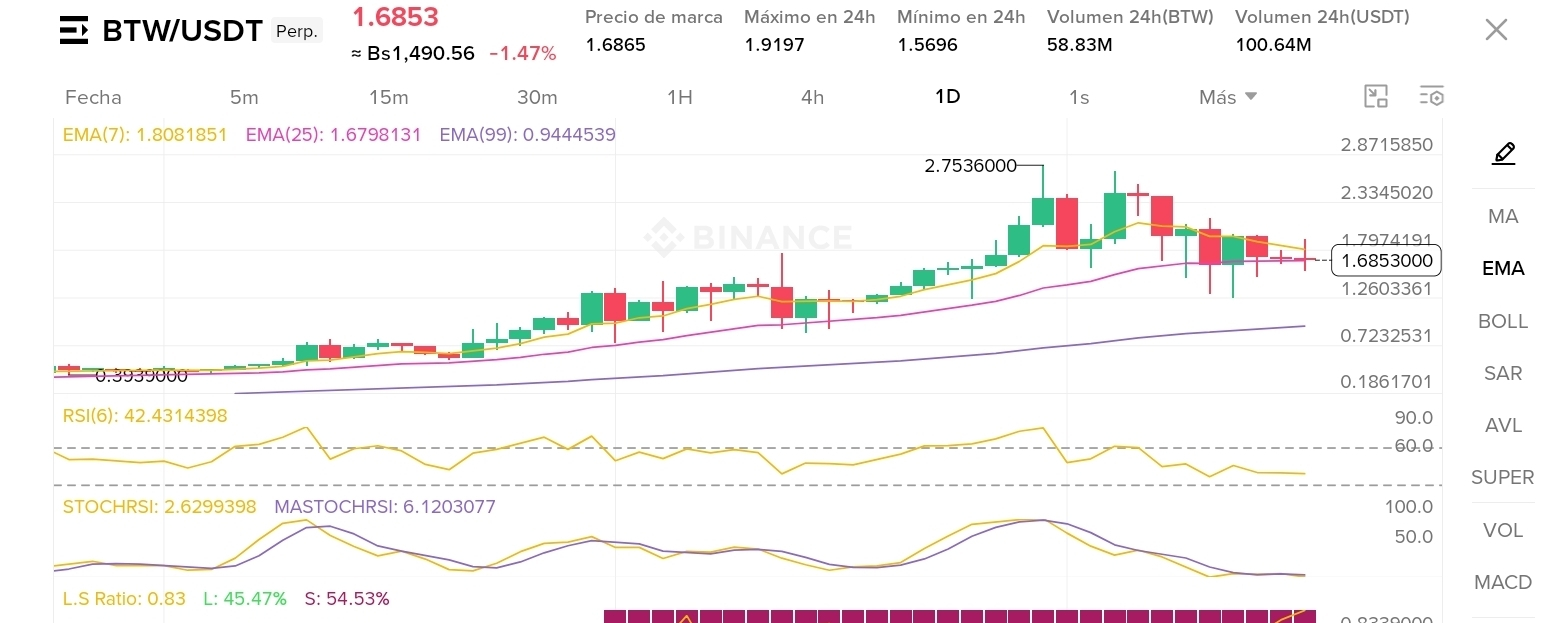
Price Action and Trend: It is currently trading at 1.6853, undergoing a moderate correction of -1.47% during the session, after reaching a 24-hour high of 1.9197 and a low of 1.5696. The overall structure remains solid above previous support levels, respecting the macro trend.
Moving Averages (EMAs):
The EMA(7) is at 1.8081 and the EMA(25) at 1.6798, showing price compression very close to the current price.
The EMA(99), positioned well below at 0.9444, continues to confirm that the broader bullish structure remains intact in the medium term.
Momentum Indicators (RSI and StochRSI):
The RSI(6) is at a balanced level of 42.43, indicating that the previous buying pressure has cooled, moving out of overbought territory and leaving clear room for a new move upward.
The StochRSI is at extremely low levels (2.62 and 6.12), a clear signal of short-term oversold conditions that has historically tended to precede interesting technical rebounds or imminent trend reversals.
Market Sentiment and Positioning (L.S. Ratio): The long/short ratio is at 0.83, with 45.47% Longs versus 54.53% Shorts. This points to a divided market where bears are gaining confidence, opening the door to a potential short squeeze if the price breaks upward on strong volume.
💡 Conclusion: We’re in a key accumulation and reassessment zone. Are we on the verge of a new upward move aiming to reclaim the $1.90 and $2.00+ levels, or would you rather wait for volume confirmation?
👇 How are you trading this move? Are you accumulating on spot or positioned in futures? Let me know in the comments! 🎯
#BTW #BinanceSquare #BinancePick #EarningsSeason