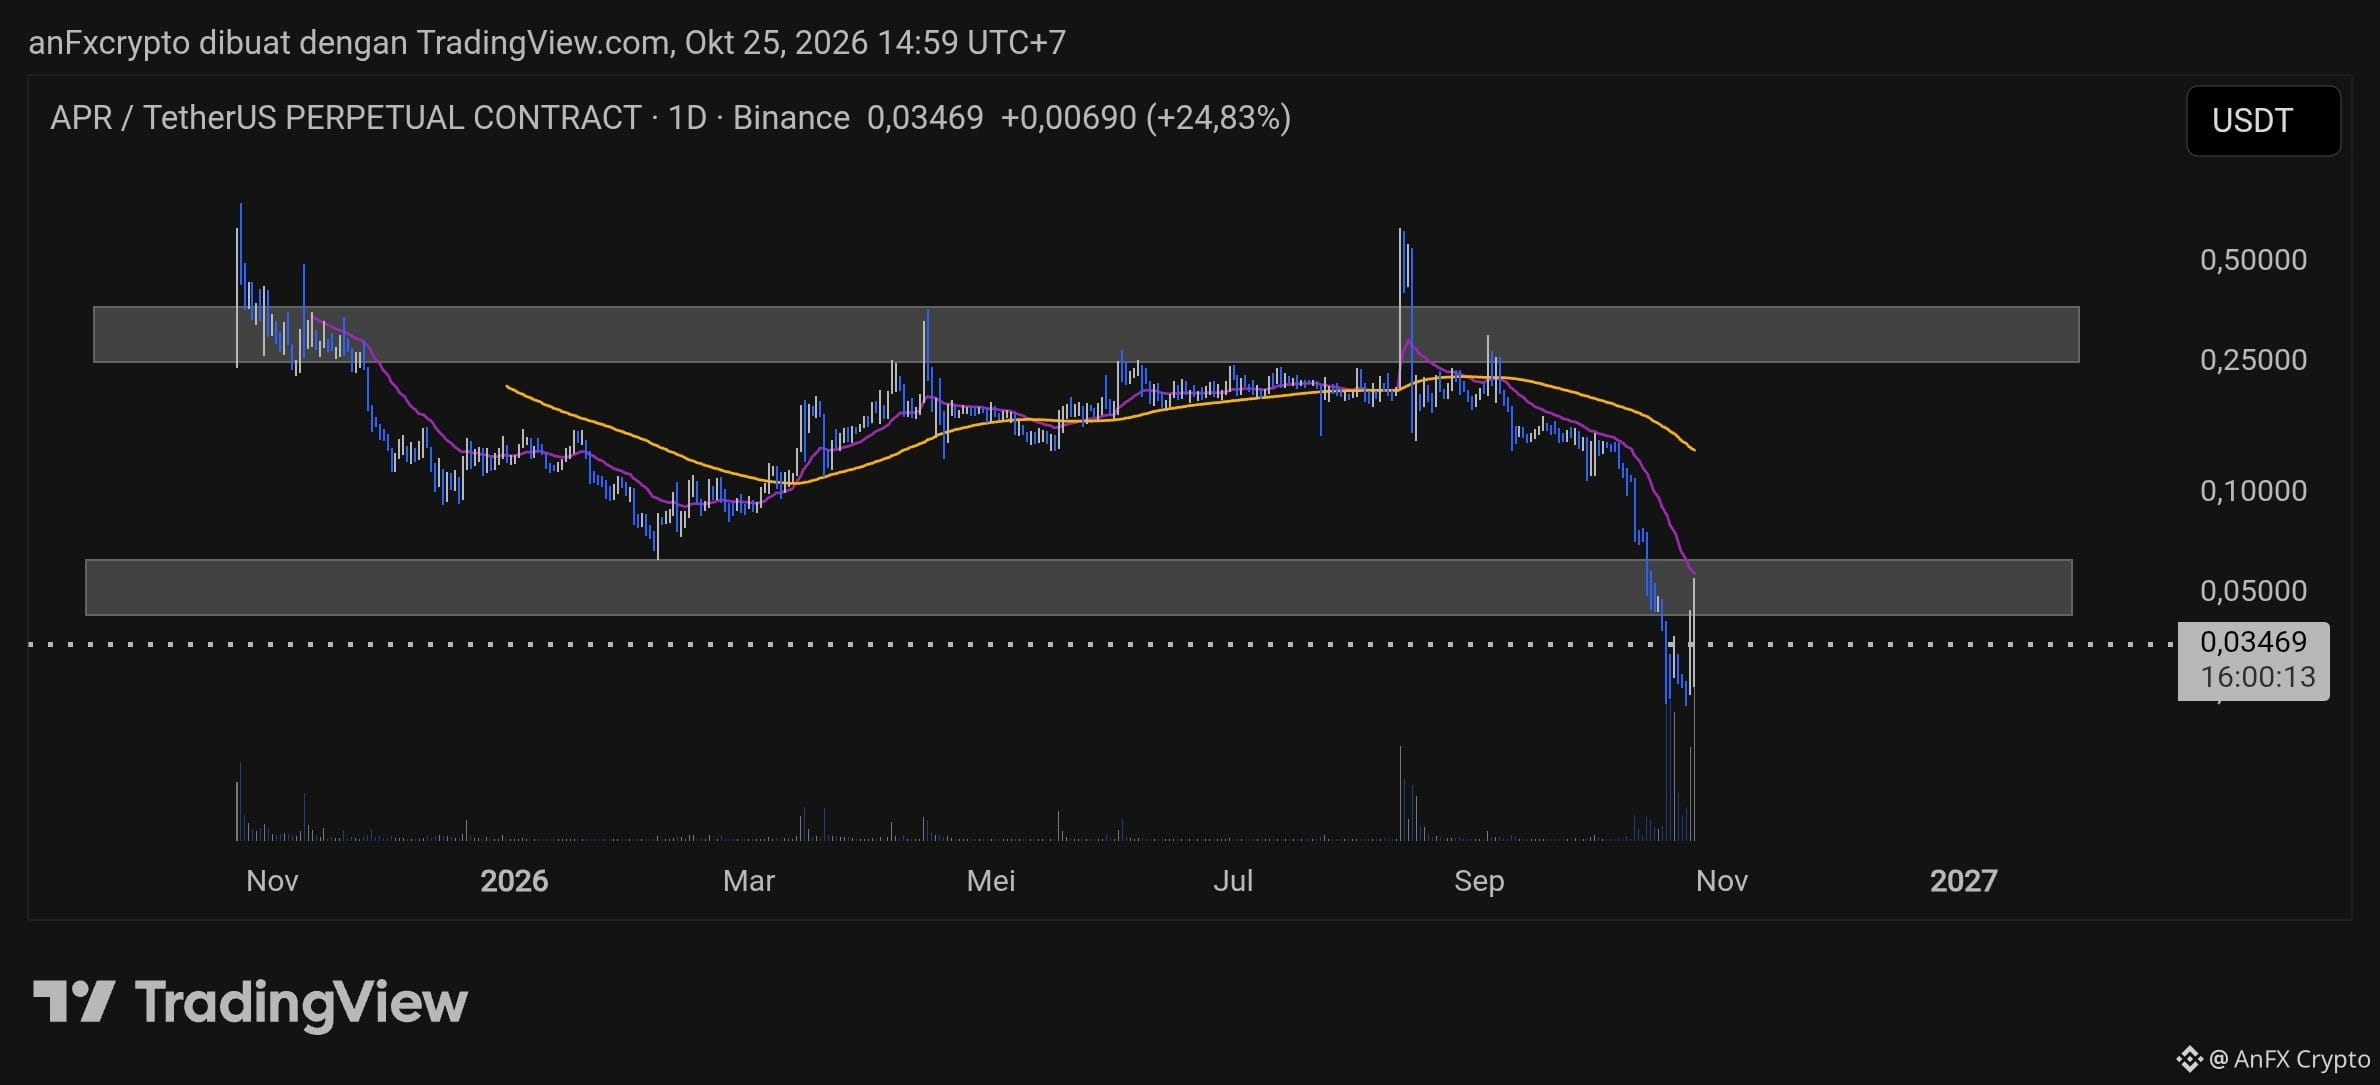
Technical Analysis: Daily chart (1D):
$APR /USDT is showing a strong bearish trend, with a pattern of lower lows and lower highs. The price broke through the key support area around $0.050 and is currently trading at approximately $0.03469. A major volume spike during the decline confirms massive selling pressure (distribution). The price is below the moving averages, indicating seller dominance.
Trading Signal: Short / Sell
Entry Price: $0.03500–$0.03700 (Taking advantage of a small bounce/pullback to the nearest resistance area)
Take-Profit Targets:
TP1: $0.03000
TP2: $0.02500
Stop Loss: Above $0.04200 (If the price breaks through the minor resistance area)
Risk Management Note: Use low leverage and a tight stop loss, as this asset is highly volatile.