Trading Outlook | 10/25 15:20
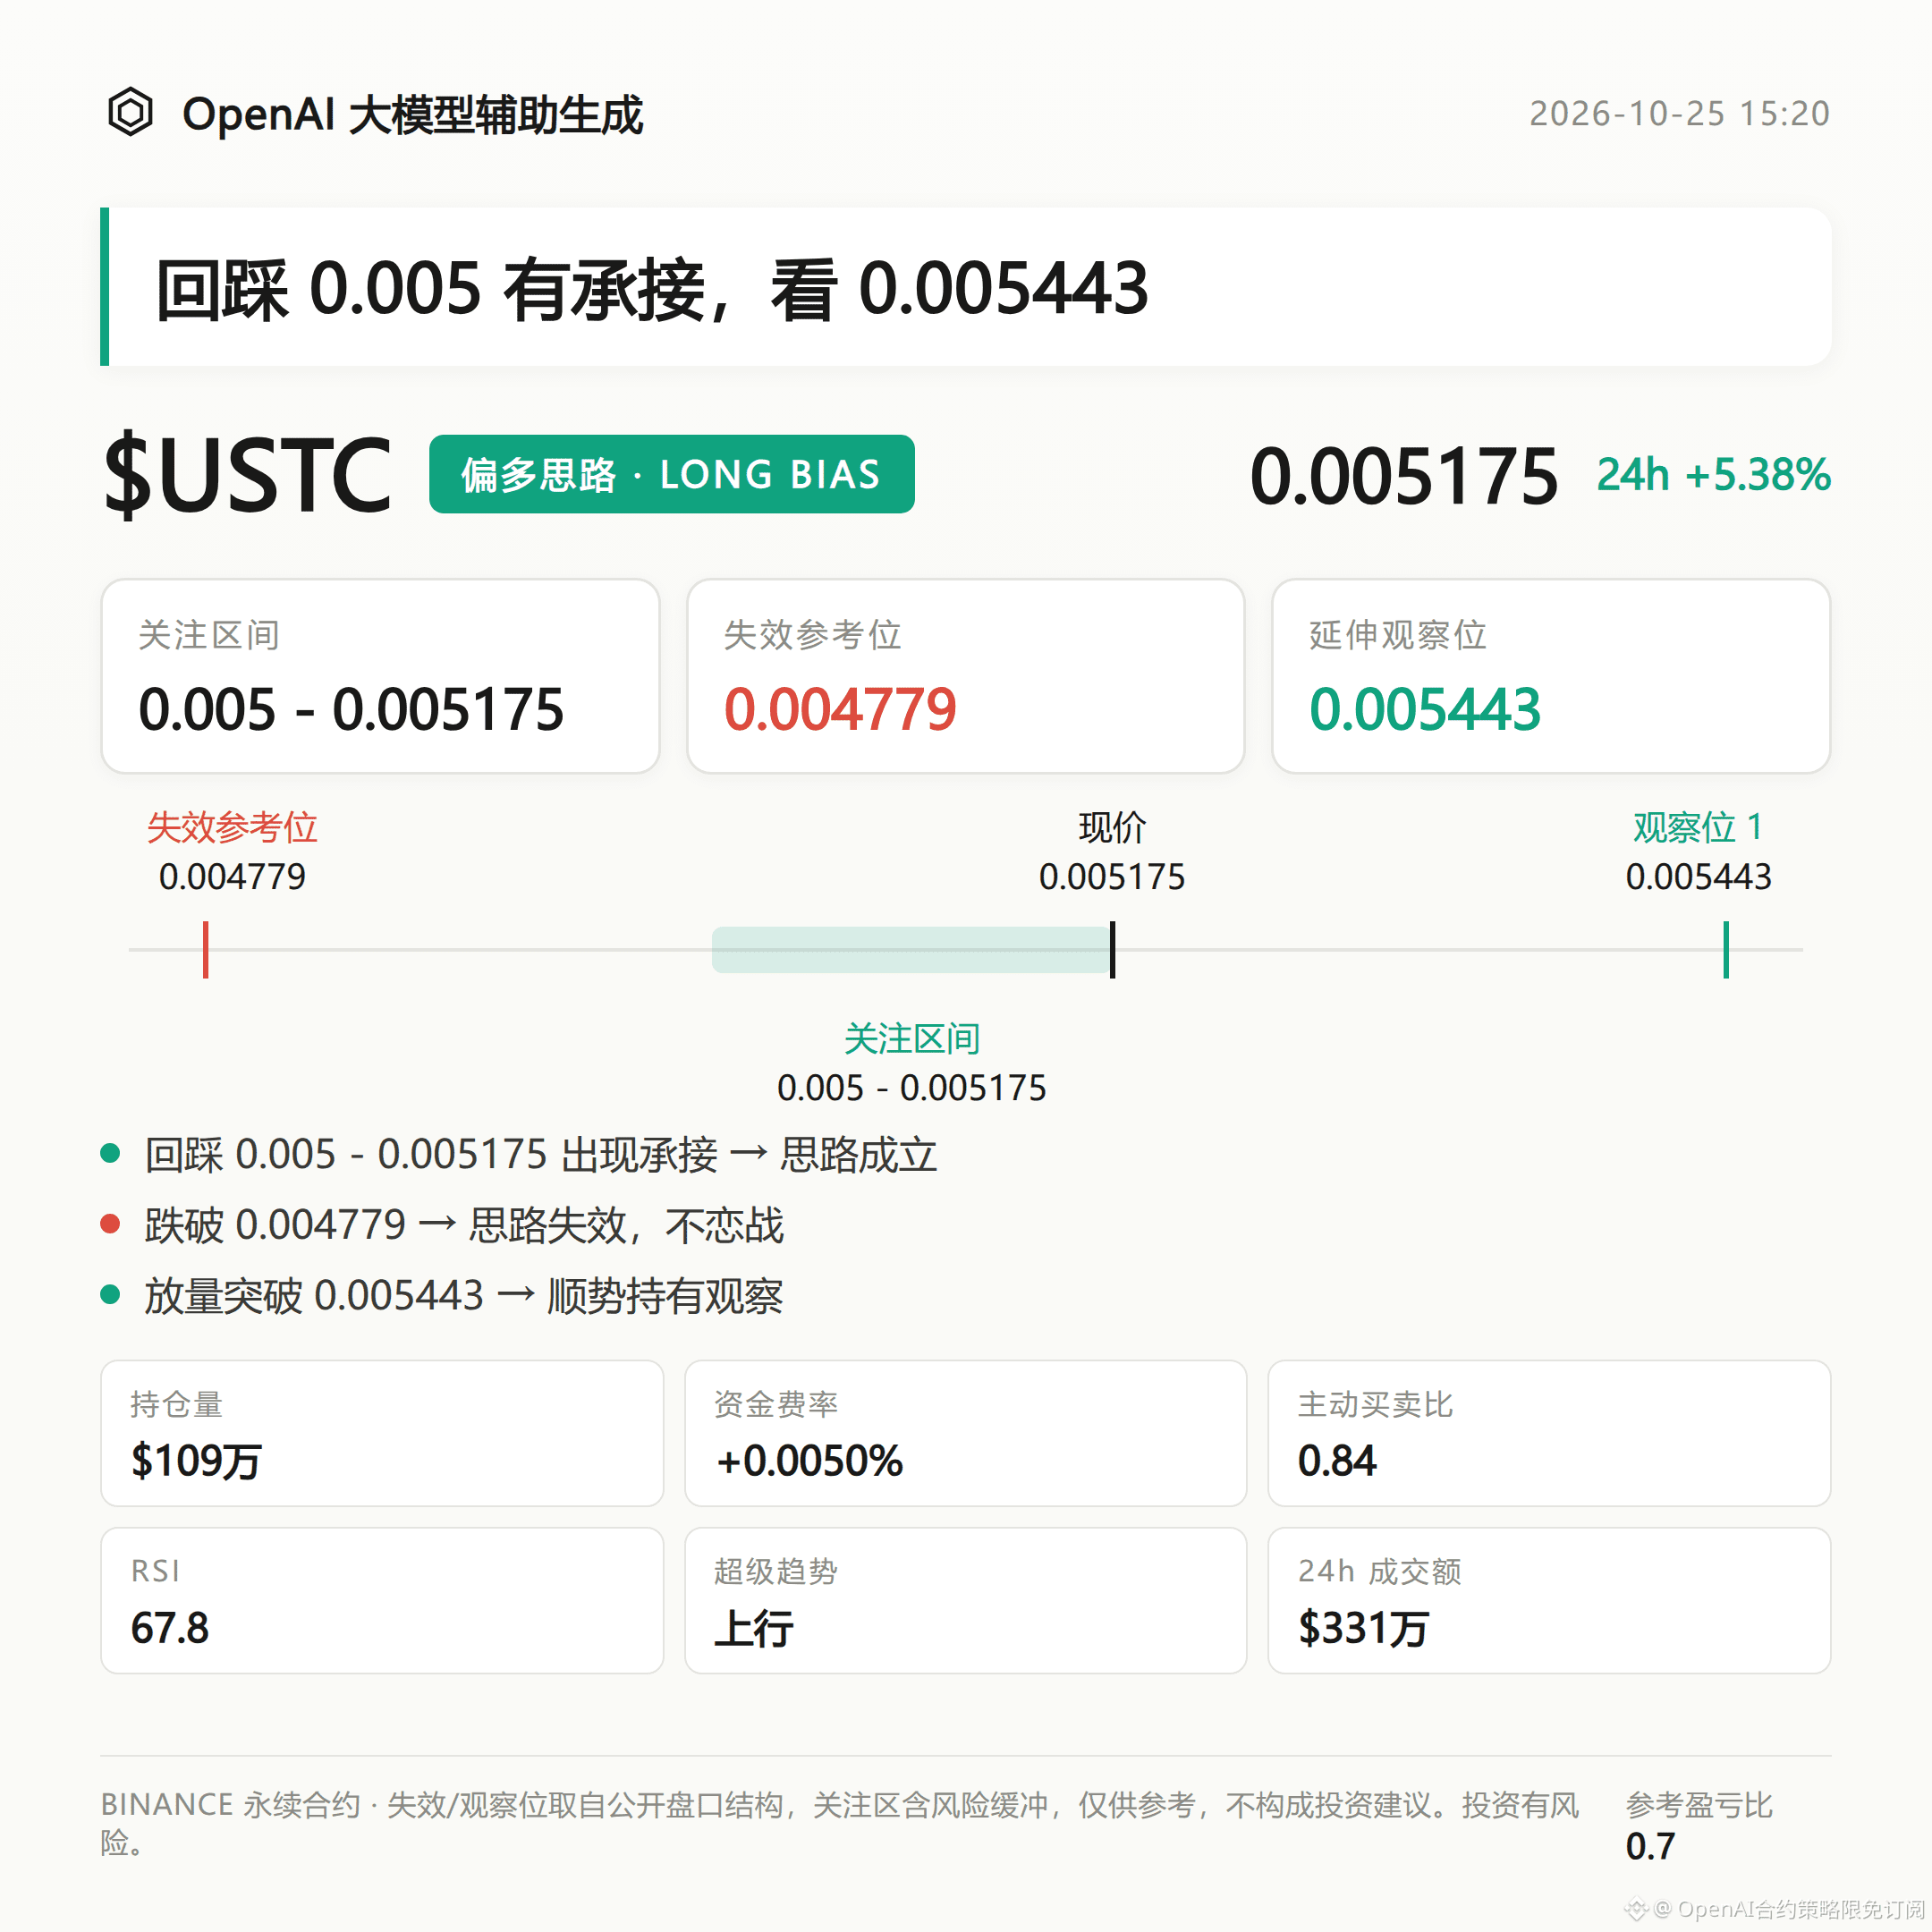
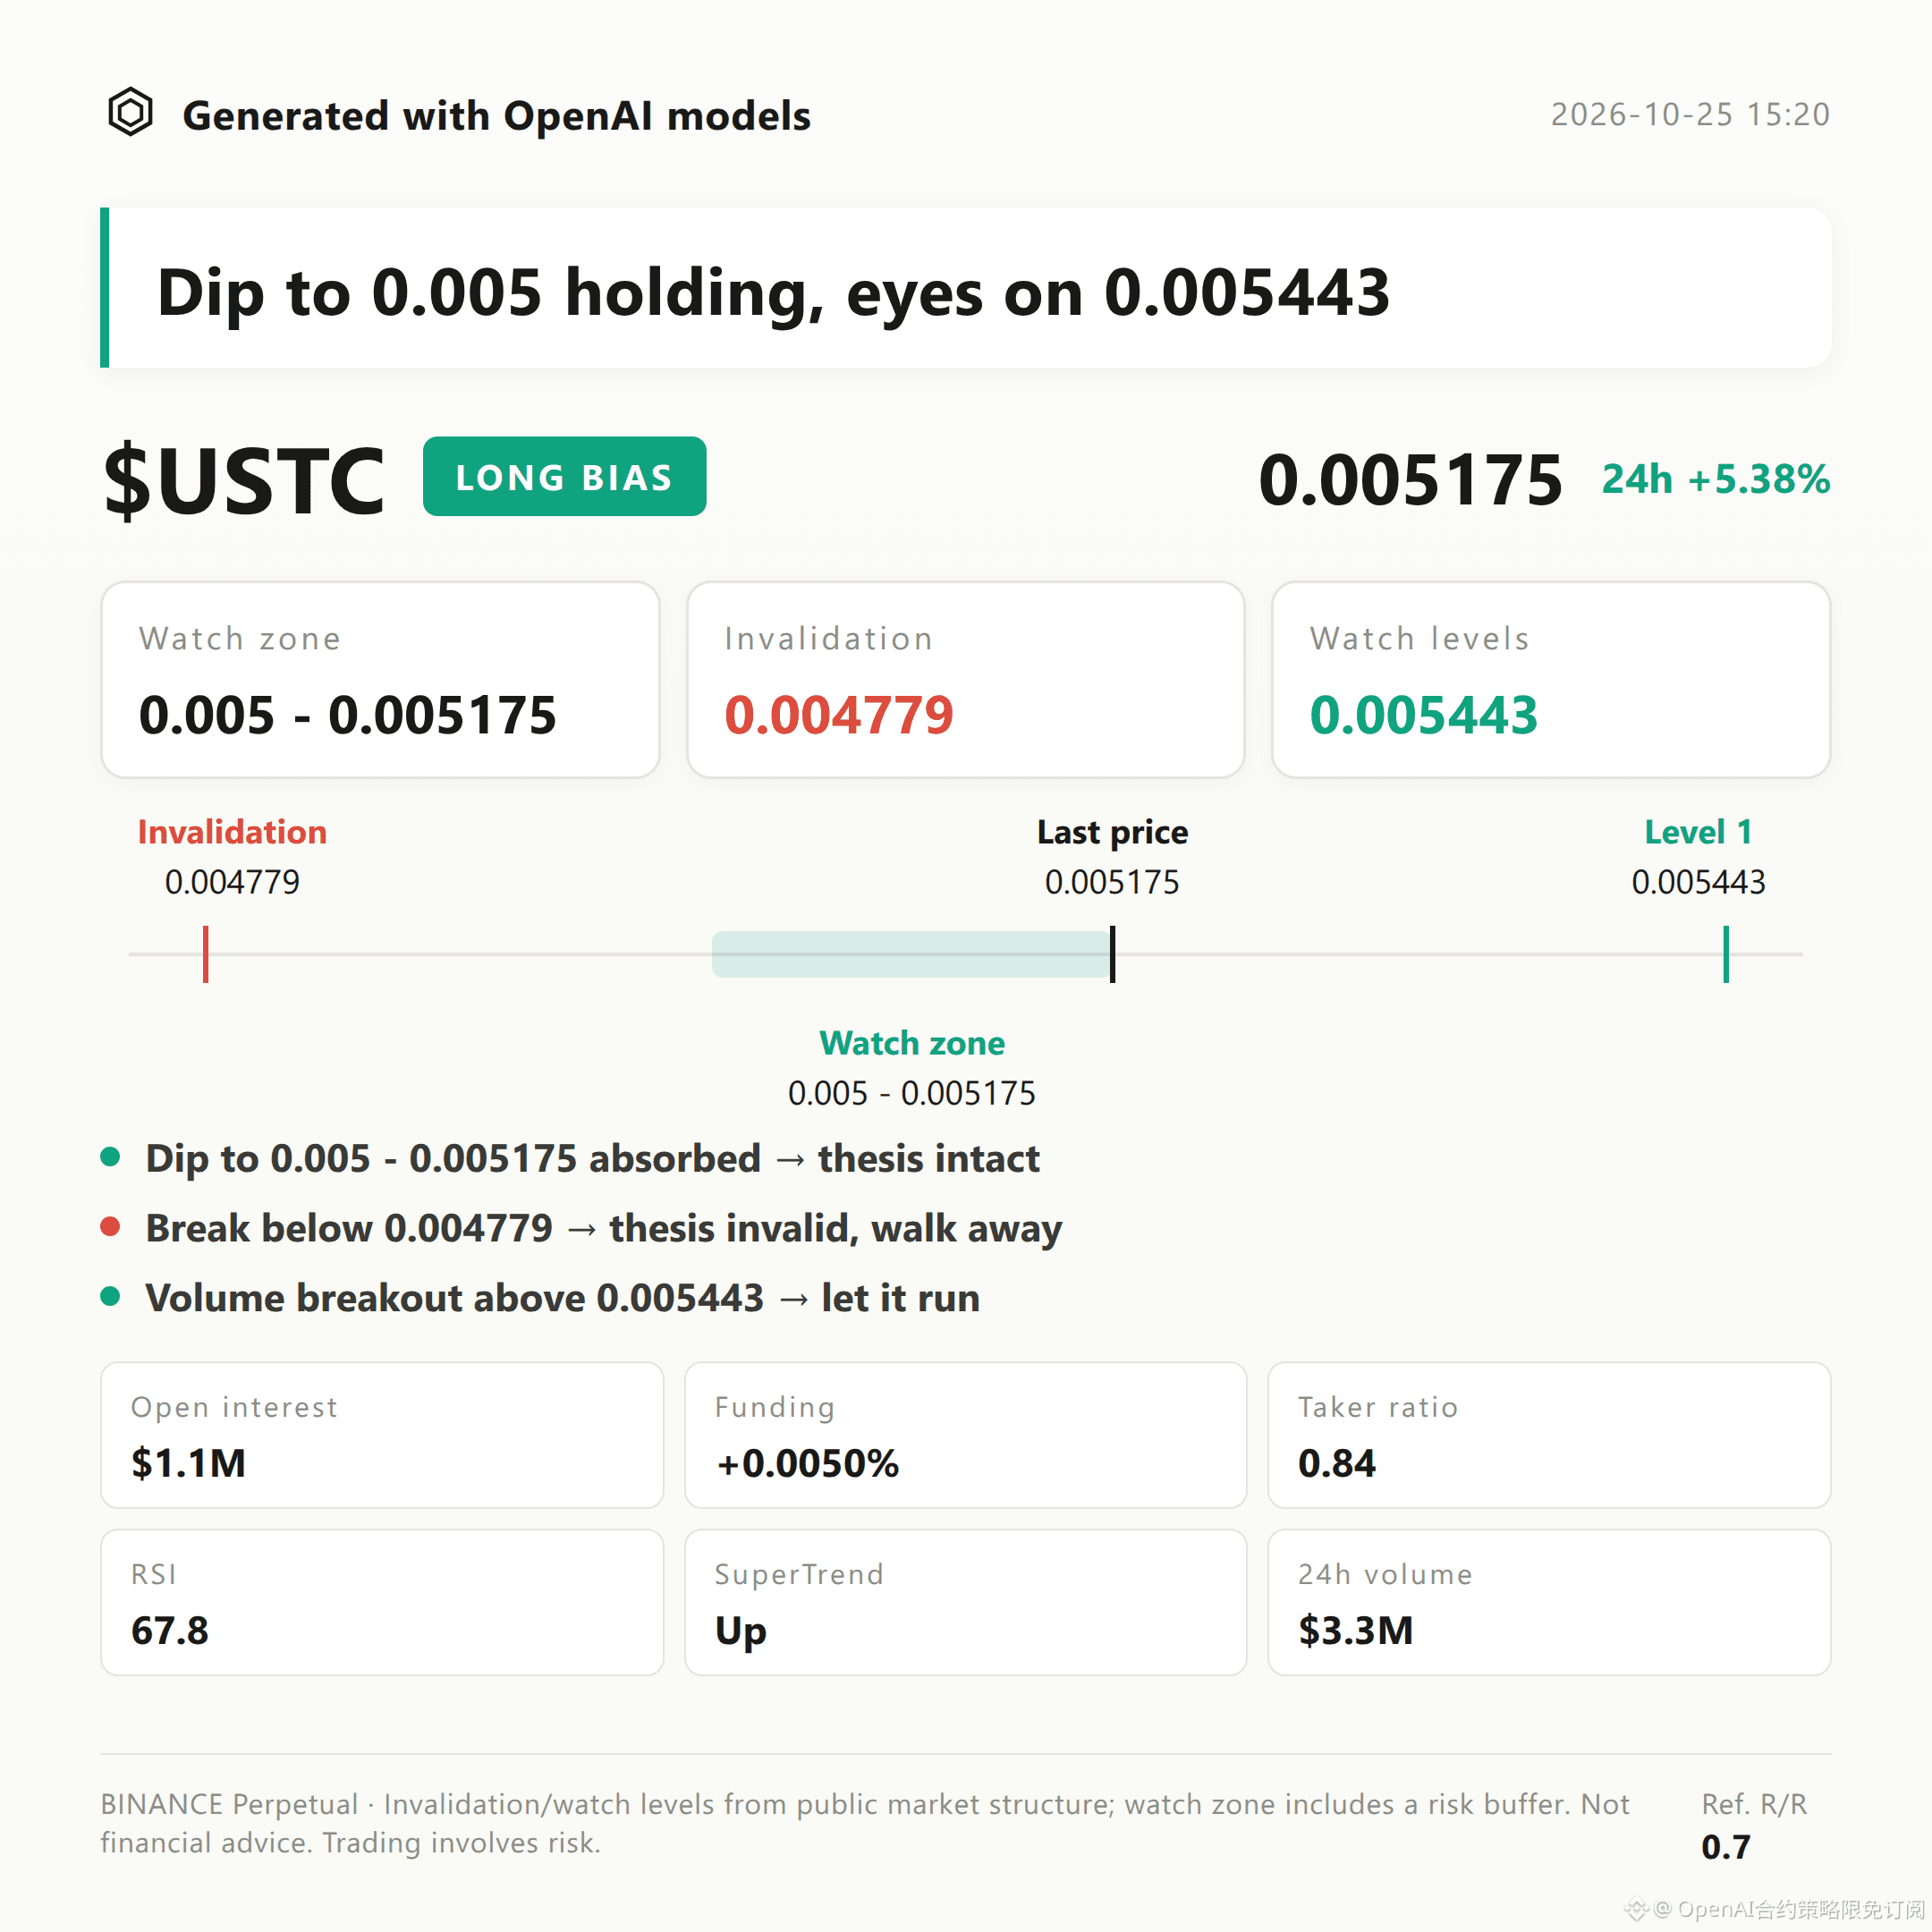
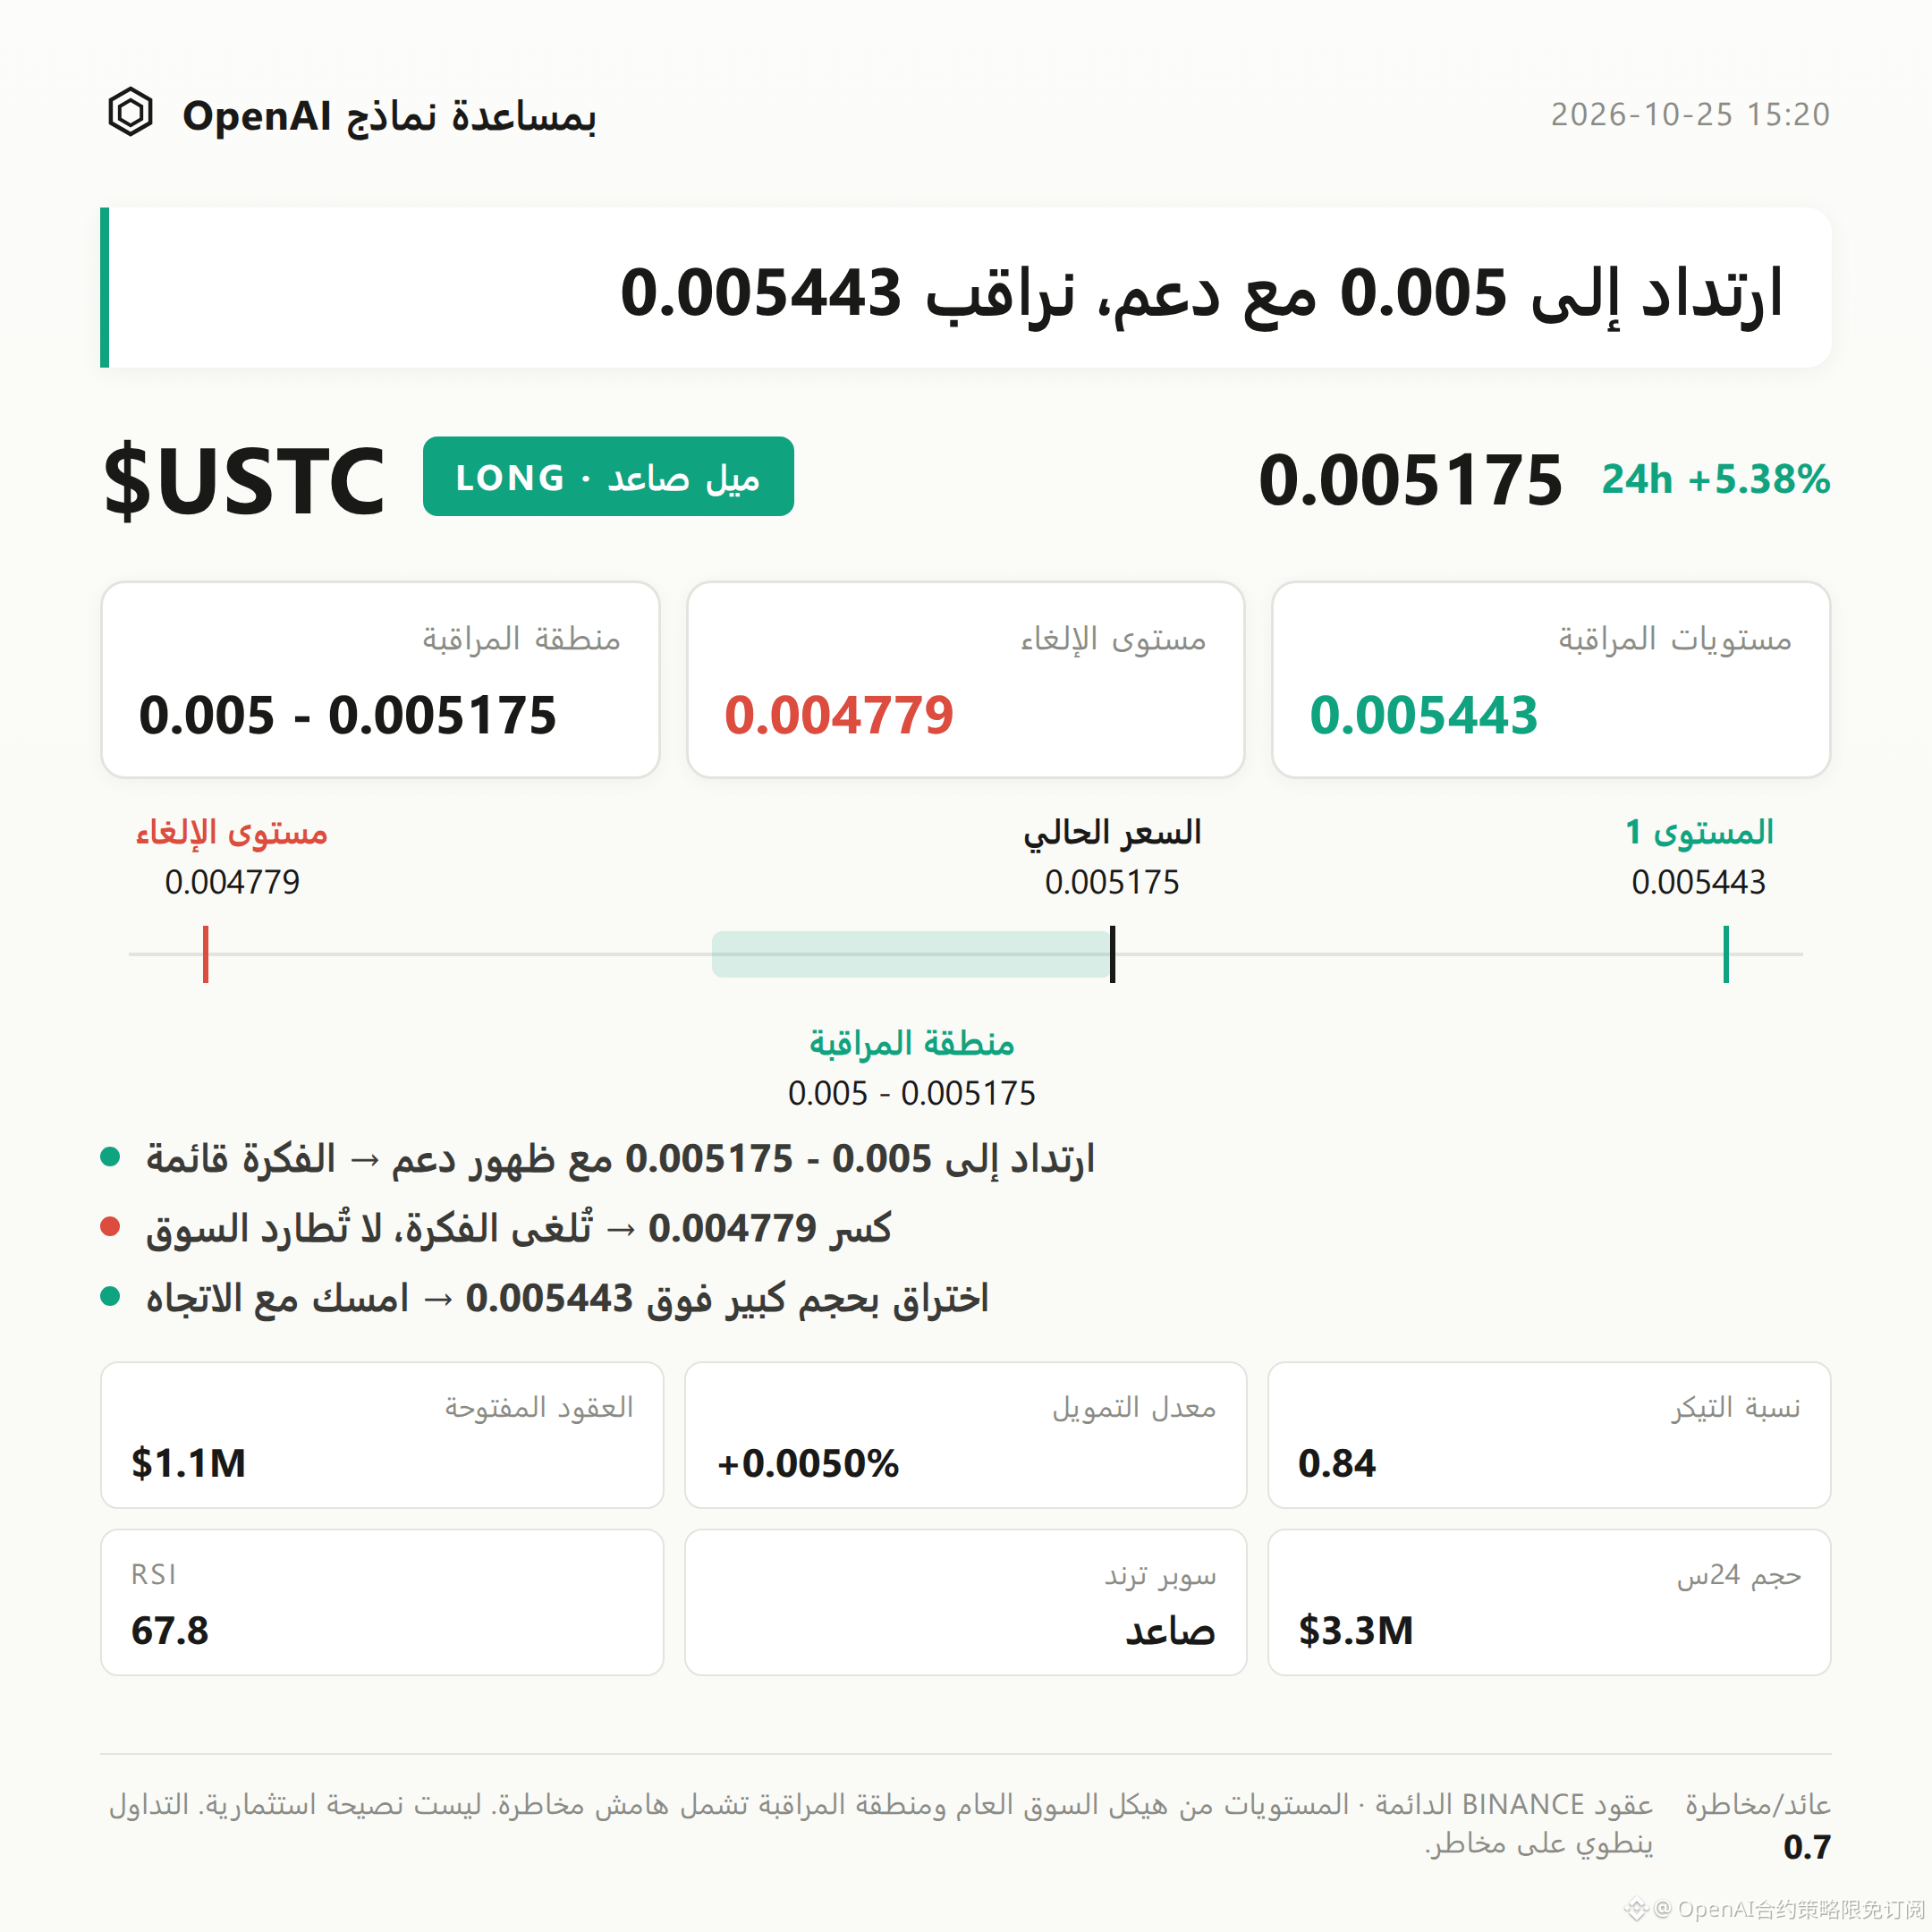
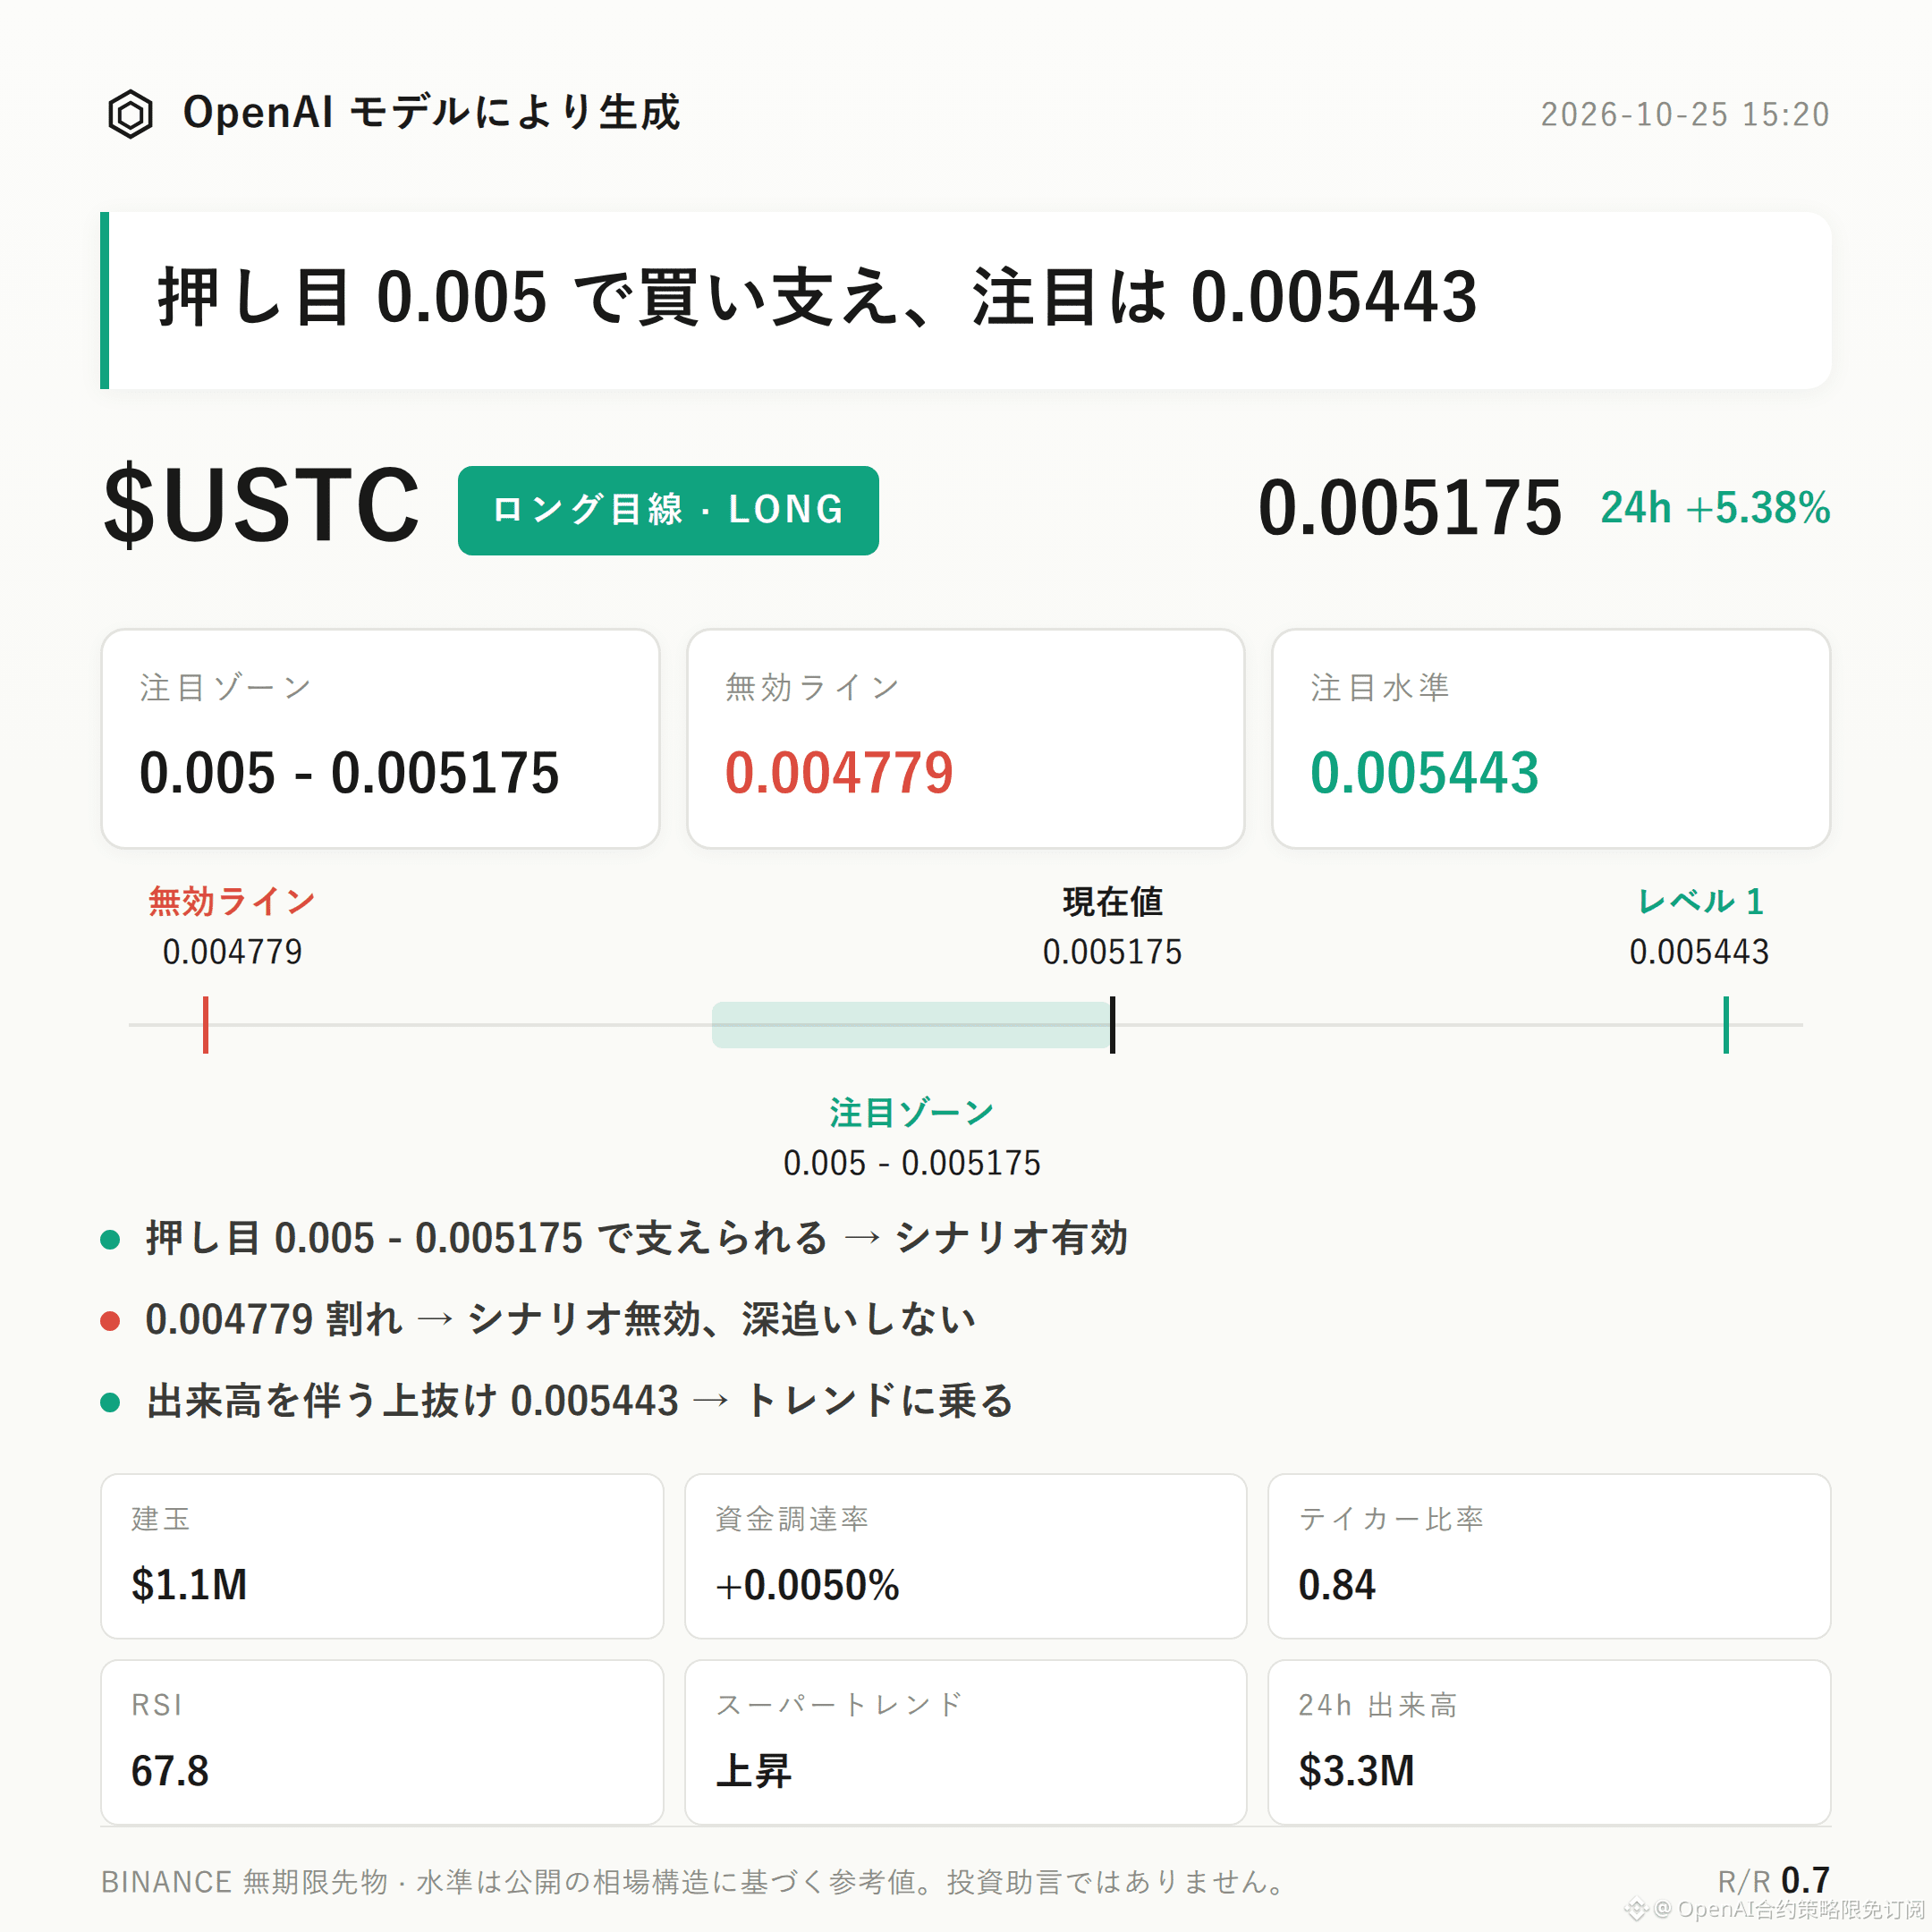
$USTC Bullish bias | Focus zone: 0.005–0.005175 | Invalidation reference: 0.004779 | Observation level: 0.005443
$USTC is currently showing a bullish structure.
The Supertrend is rising, MACD continues to show bullish momentum, and open interest has increased 18.0% over the past 24 hours. These are the key reasons behind the current bullish outlook.
The main focus is whether the price can continue to find support in the key bullish reference zone, confirming that the structure can persist intraday and over the next few days.
The current price is 0.005175, up 5.38% over the past 24 hours, and the trend-following characteristics remain intact.
Price is above the Bollinger upper band at 0.0051; the middle band is 0.005 and the lower band is 0.0048. The recent trading range is between 0.004779 and 0.005443.
The RSI is 67.8, with momentum still in a healthy range. However, as the price approaches recent highs, watch for increased volatility.
24-hour trading volume is $3.31 million, and open interest is $1.09 million. Open interest has also increased 18.0% over the past 24 hours, indicating that market participation is rising in tandem.
The funding rate is +0.0050%, and 62% of accounts are long, suggesting a market bias toward the bullish side.
However, the taker buy/sell ratio is only 0.84, meaning aggressive buyers do not have the upper hand and sellers are still applying pressure during the rise.
For the bullish setup, first watch the 0.005–0.005175 zone; it is preferable to wait for confirmation after a pullback finds support.
If the price pulls back into this focus zone and finds support, the bullish outlook remains valid.
A break below 0.004779 would indicate that the current upward structure has been broken and invalidate the bullish outlook. The price should no longer be interpreted as following a bullish structure.
If a subsequent increase in volume confirms that the price has held above the first observation level at 0.0051, then watch the higher extension level at 0.005443.
Risks to the contrary include the taker buy/sell ratio of 0.84, indicating that buyers do not have the upper hand. With 62% of accounts long and the funding rate positive, be alert to a pullback if long positions become overcrowded.
The reference risk/reward ratio is 0.7, so the current risk/reward profile is not particularly attractive. It is more important to wait for structural confirmation.
With leveraged contracts, position discipline matters more than getting the directional call right.
For reference only; this is not investment advice. Contracts involve leverage, and investing carries risk.
This article was generated with the assistance of an OpenAI large language model.
$USTC #ContractAnalysis