

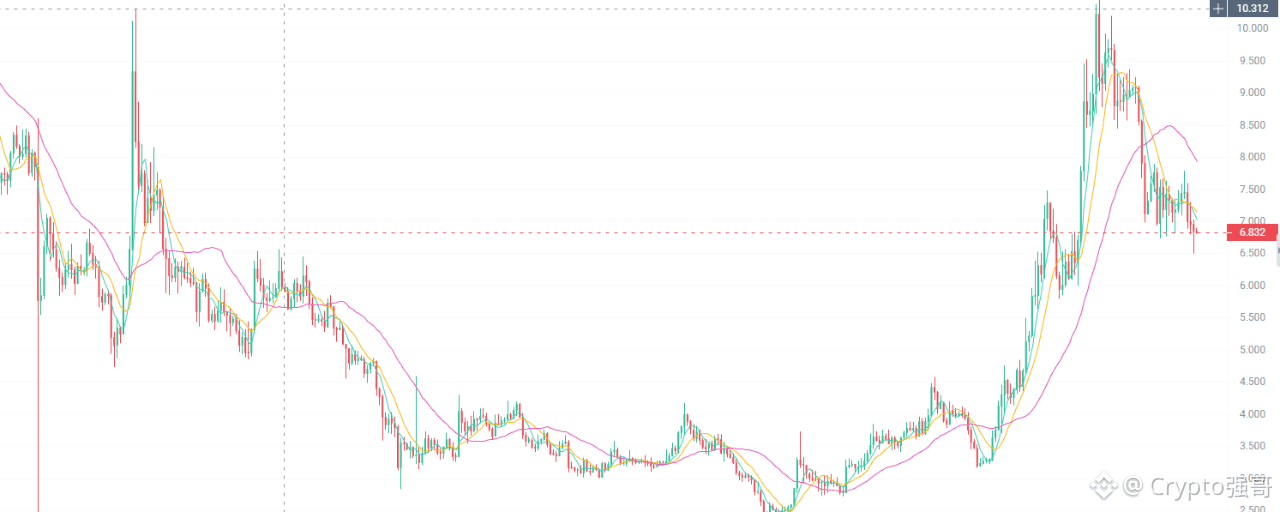

(October 25) $UNI The current price is 6.822 USDT. Today’s trading focus is to watch whether the rebound can continue and whether bears accelerate after a key support level is breached. The short-term outlook leans bearish, but trade quality depends not on simply guessing whether prices will rise or fall, but on entry points, stop-loss discipline, and trend confirmation.
Please note: No actual candlestick chart has been provided, so the technical analysis framework and short-selling plan below are based on the current price. Specific signals from moving averages, MACD, RSI, and support and resistance levels still need to be confirmed against live candlestick data.
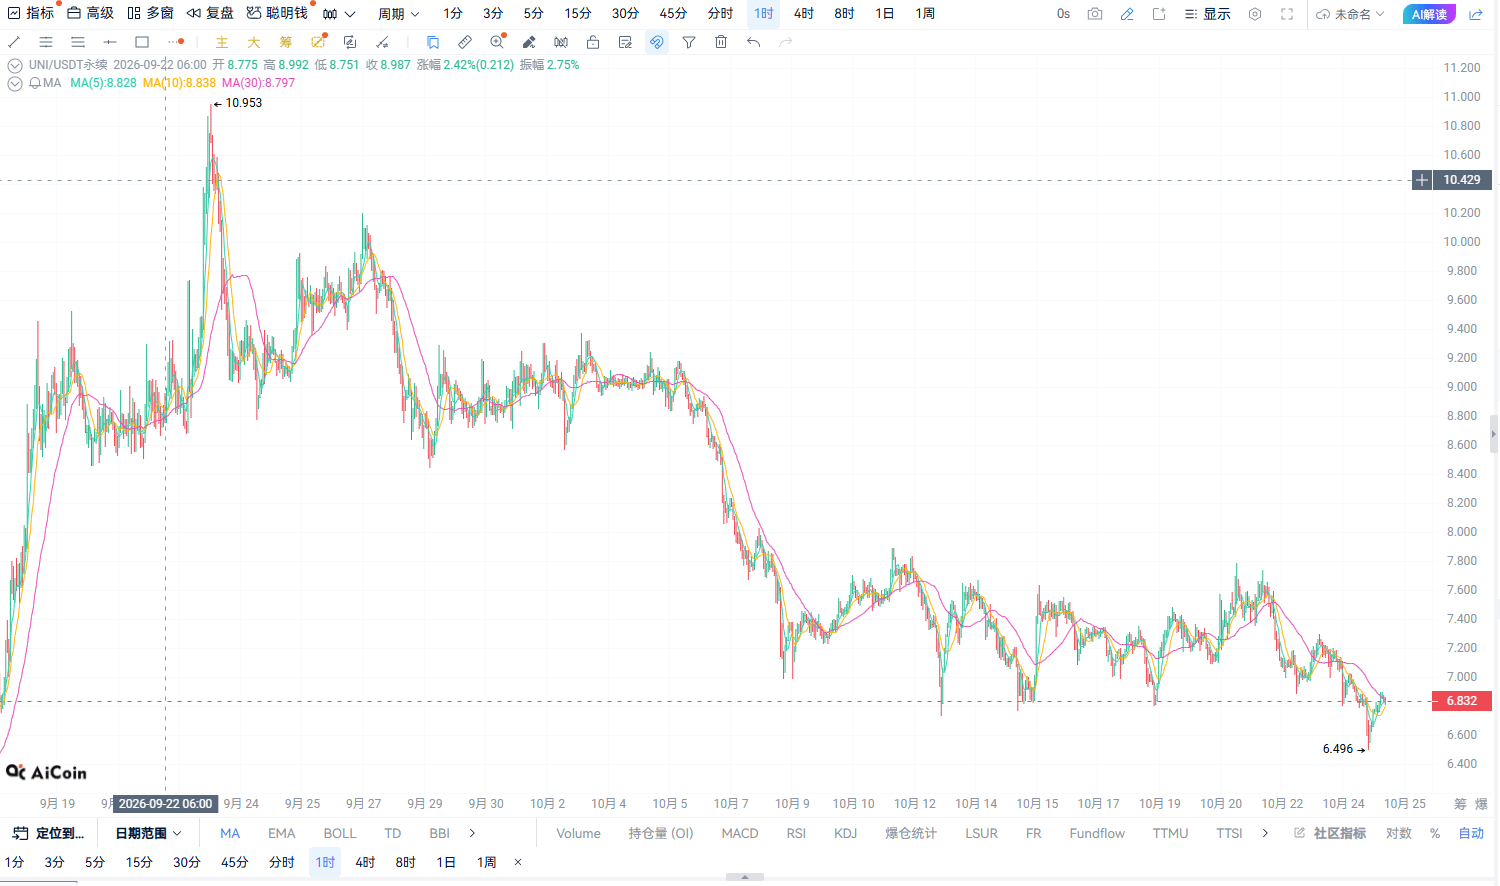
I. 1-hour chart: Whether the rebound can continue is key to short-term short positions
The 1-hour chart is mainly used to observe the pace of short-term fund flows. UNI is currently at 6.822. Next, pay close attention to the strength of any rebound and how the price behaves near the short-term moving averages.
If the price reaches a resistance area and repeatedly forms upper wicks and pulls back after rising, or if trading volume gradually declines during the rebound, this may indicate insufficient buying momentum and a chance of renewed short-term weakness.
Conversely, if the price continues to rise on increasing volume and holds firmly above the short-term resistance area, be alert to a rapid rebound driven by short covering.
Trading approach: Prioritize shorting opportunities after a rebound is rejected. Do not blindly chase a market that has already fallen sharply.
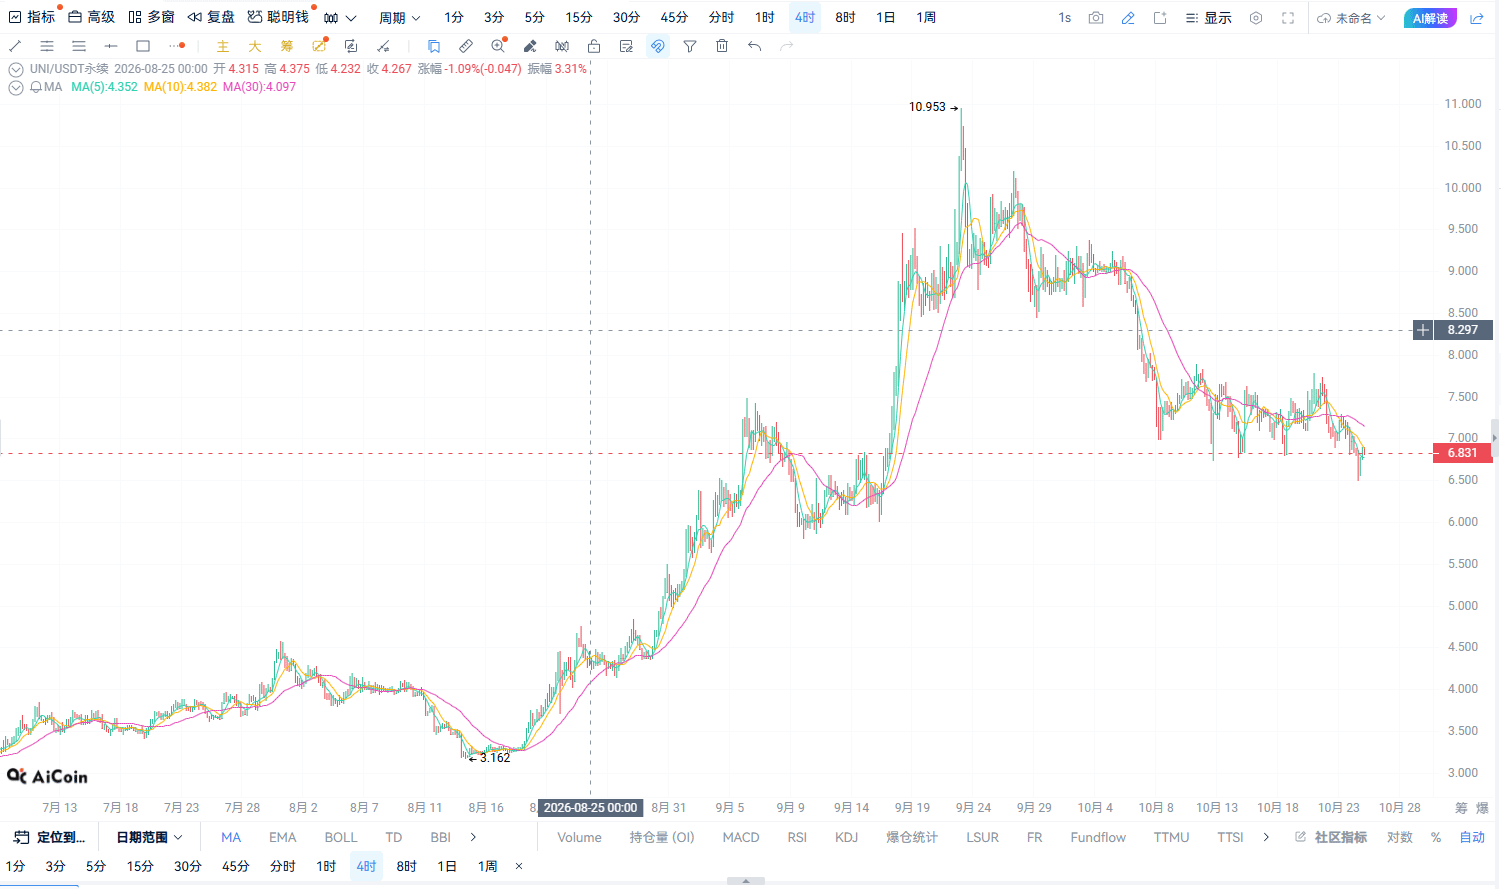
II. 4-hour chart: Focus on whether the trend is turning bearish
The 4-hour chart determines whether this trade has a stronger trend basis. In your analysis, pay attention to the structure of price highs and lows, the moving-average alignment, and whether a broken support level turns into resistance.
If UNI cannot break above its previous high during a rebound and then continues to make lower lows, the market may be gradually forming a bearish structure. If the price breaks below key support and then stages a weak rebound, the case for continued downside becomes stronger.
However, if the price regains and holds above key resistance, accompanied by a clear increase in trading volume, the original short thesis needs to be reassessed.
Trading approach: Wait for a rebound to be rejected or for a failed retest after a breakdown. Avoid blindly increasing your position before the trend is confirmed.
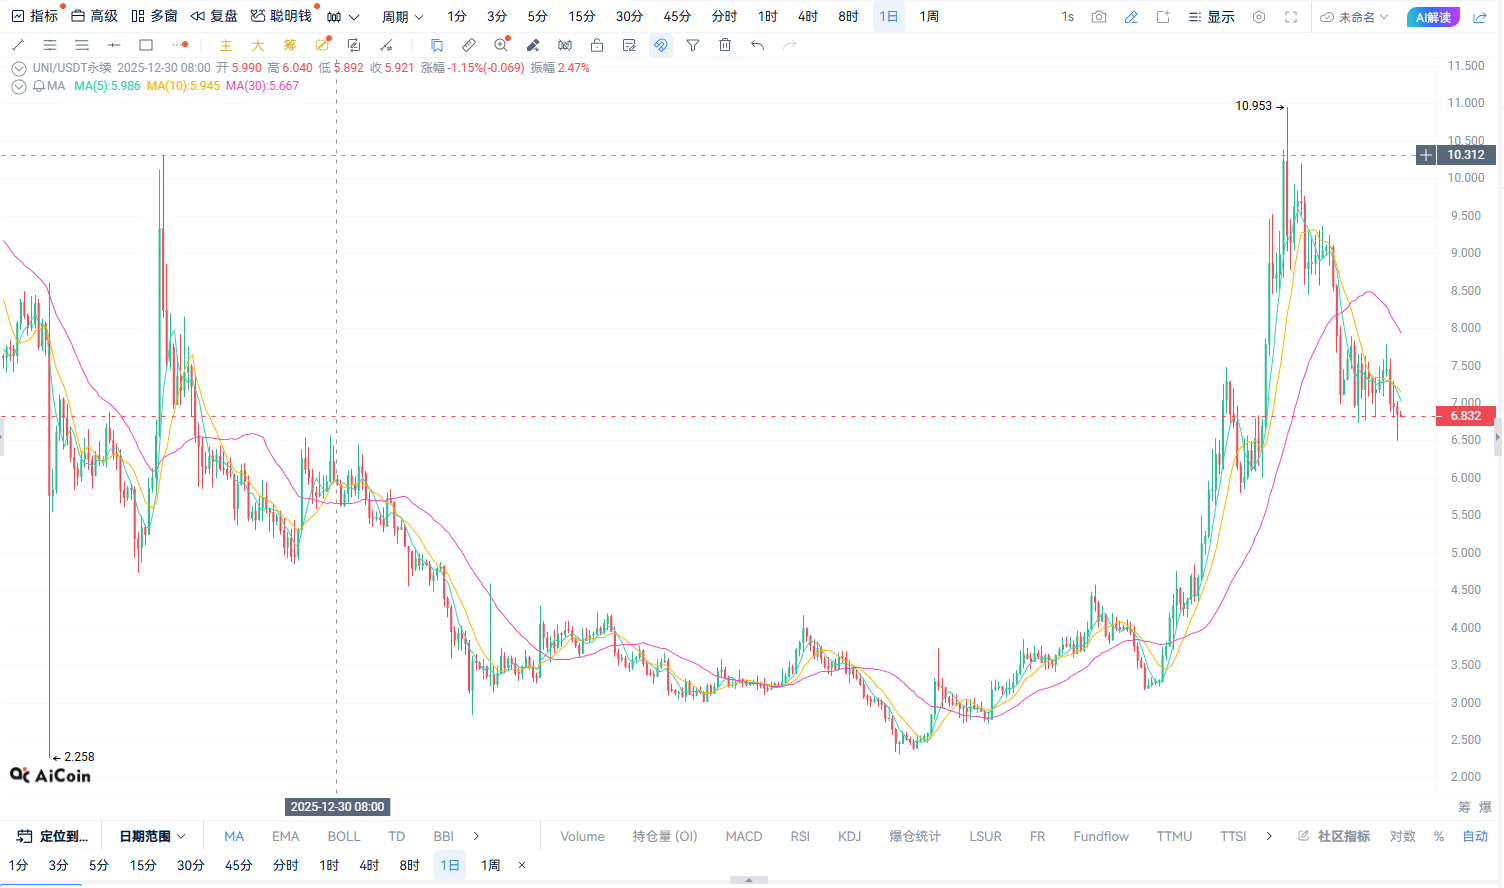
III. Daily chart: Determines whether a short position has greater downside potential
On the daily chart, focus on UNI's recent trend structure and whether there is meaningful support in important support areas.
If the daily chart continues to show lower highs and weak rebounds, a short-term short position may align with the broader trend. If the daily chart is showing clear signs of a bottom, or the price has repeatedly reclaimed important moving averages, the short-term decline may simply be a normal pullback.
Therefore, do not conclude from the current price alone that UNI has entered a downtrend. Confirm the view against the actual daily-chart structure.
Trading approach: Use the daily chart to determine direction, the 4-hour chart to confirm the trend, and the 1-hour chart to identify entry timing. Cross-checking across time frames can reduce misjudgments caused by relying on a single time frame.
IV. UNI trading strategy for today
Plan with a bearish bias today and focus on three signals:
Rebound rejected: The price struggles to move higher and pulls back after rising.
Support gives way: The price breaks below a key level, then fails to reclaim it on a rebound.
Risk management: Set a stop-loss in advance and do not change your trading discipline in response to short-term fluctuations.
If the price continues to strengthen on increasing volume, do not stubbornly maintain a bearish view. The goal of trading is not to prove your judgment right, but to manage risk promptly when the market does not move as expected.
V. UNI live trade
Trade date: October 25 · Reference price: 6.822 USDT
Position direction: Short
Entry price: 6.822
Stop-loss price: 6.924
First take-profit: 6.754
Second take-profit: 6.686
Execution guidance: The short-position plan at the current price assumes you are willing to accept the risk of an adverse price move. Consider taking partial profits at the first target and monitoring the remaining position for the second target. If the stop-loss is triggered, exit according to plan; do not add to the position against the trend.