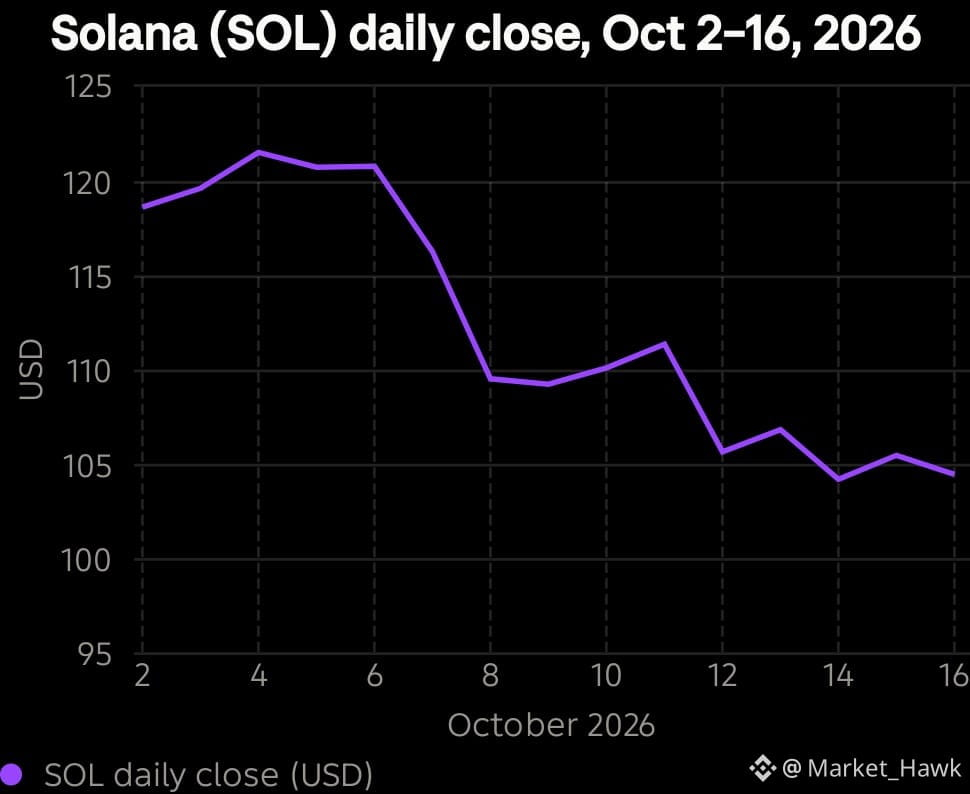
$SOL
is trading around $104 and has been bearish to sideways since early October.
Price: About $104.03 on October 23, roughly 65% below its all-time high of about $293. (metamask)
Trend: SOL fell from about $121 in early October after breaking support near $116 on October 8, then settled into a $100–$110 range.
Levels: The $100 area is the floor, with a swing low at $100.32. On October 21 SOL pushed to $108.26 intraday but couldn't hold above the 50-day EMA. Resistance sits around $108–$120, and the range could break down if $100 gives way. (coindcx)
Sentiment: One analysis noted ETF flows turning negative. The 30-day move is down roughly 12%. (admiralmarkets)#BinancePick #EarningsSeason #DowDrops653Points #MarketsPriceJust10%ChanceOfFedHikeNextWeek