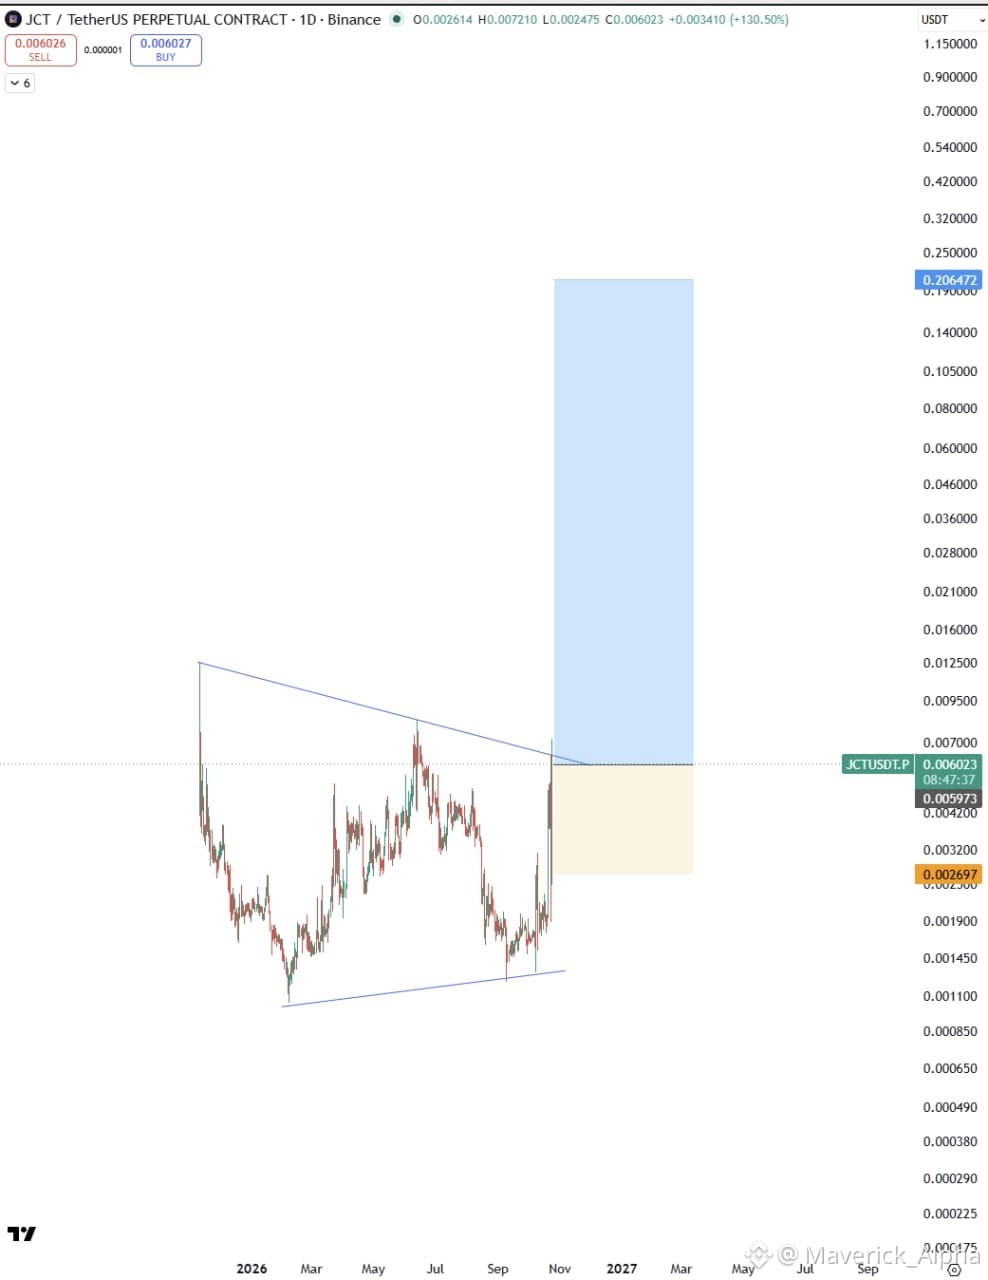
JCT: A LONG-TERM BREAKOUT MAY BE FORMING.
The chart suggests a multi-month symmetrical triangle, with price testing the upper trendline after rebounding from support.
What matters now
Bullish trigger: A confirmed weekly close above resistance with rising volume.
Retest: Former resistance must hold as support.
Invalidation: A breakdown below the recent swing low weakens the setup.
Target: Measure the triangle’s height from the confirmed breakout—not before it.
The screenshot alone doesn’t confirm a breakout, and the distant target zone is speculative until price clears resistance.
My take: Watch the weekly close and volume. Structure creates the opportunity; confirmation validates it.
#JCT
$JCT