


LIQUIDITY SWEEP OR IMMINENT BOUNCE? 📊🔥
Happy Saturday, Binance Square community! The weekend is kicking off with high volatility, and the market is giving us key signals on the 1H timeframe.
Here are the crucial points we’re seeing in the technical structure and the attached liquidation map:
1️⃣ Technical Structure (1H):
The price is trading around $80,440 after testing a recent low at $80,392.
The price continues to trade below the key exponential moving averages (EMA 9, EMA 21 and the EMA 200 above $82,060), which keeps short-term bearish pressure in place unless it breaks through on volume.
The RSI (14) is around 34.4, approaching oversold levels. On intraday charts, this often signals selling exhaustion ahead of a technical breather or a weekend range.
In the spot order book, a strong immediate sell wall stands out, with 90.69% of the orders being asks versus 9.31% bids, reflecting buyer caution at this level.
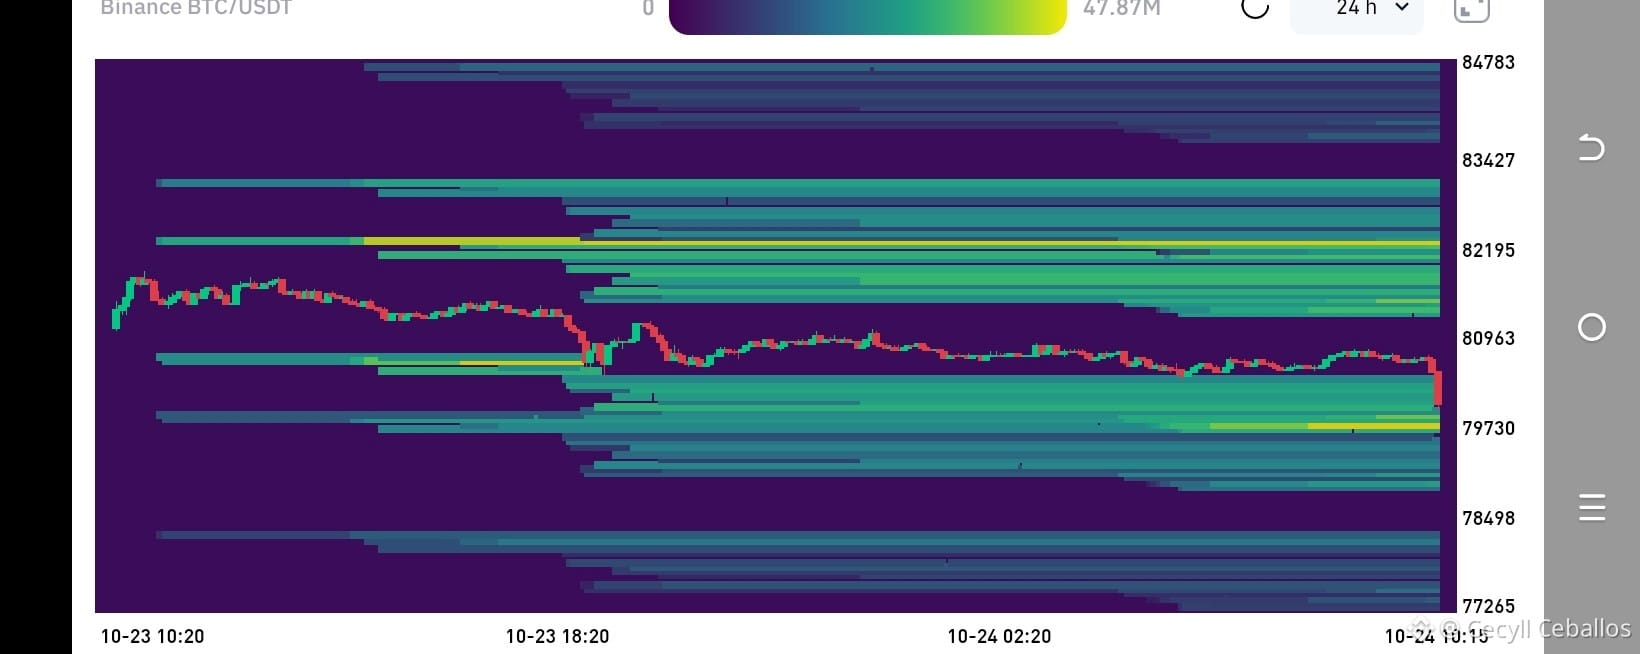
2️⃣ Liquidation Heatmap (CoinGlass 24H):
On the attached map, we can clearly see two high-liquidity magnetic zones:
Support Zone / Long Liquidations: The range between $79,700 and $80,000 shows a bright accumulation of liquidity. If the price fails to consolidate above $80,400, a quick wick down to sweep stop-losses in that psychological zone cannot be ruled out.
Resistance Zone / Short Liquidations: On the upside, the densest and hottest cluster is located between $82,000 and $82,300. A recovery toward that level would provide bullish fuel through massive liquidations.💡 Weekend Outlook:
Saturdays tend to have lower institutional volume, making sharp moves toward areas with the highest concentration of liquidity more likely. Be patient, manage risk strictly, and be careful about trading with excessive leverage.
If you like my analysis, give it a like. Follow me and I’ll follow you. Leave a comment, and thanks so much.
#BTC #Bitcoin #Render #CryptoTrading #BinanceSquare #LiquidationHeatmap #TradingStrategy #Altcoins #TechnicalAnalysis