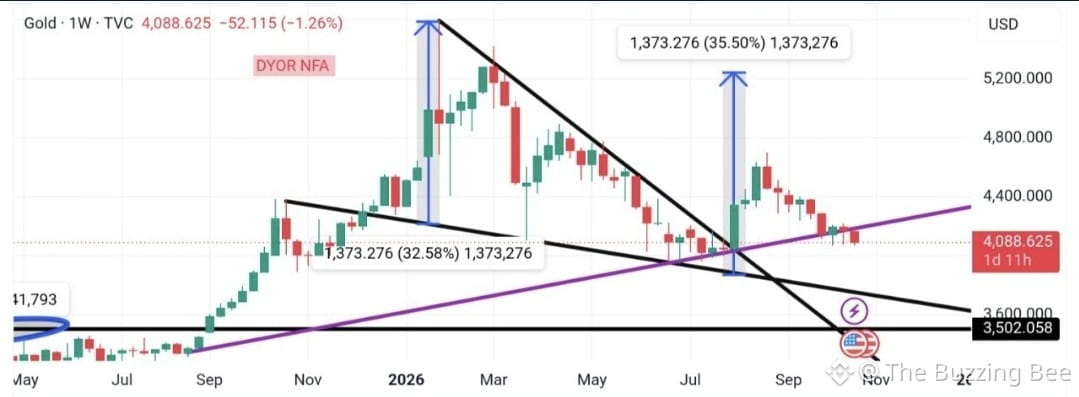
💥💥 Wedge Breakout: Gold Retests Ascending Trendline Support
Analyzing the Gold weekly chart structure, price action recently broke out above the black descending wedge resistance pattern.
Following the breakout, price action initiated a strong expansion move toward higher technical levels before undergoing a corrective pull-back to retest the multi-year purple ascending trendline support. Currently, price action is consolidating along this key purple trendline support zone.
A sustained hold above the purple ascending trendline support could potentially allow price action to regain upward momentum and target upper resistance boundaries.
To preserve this bullish wedge breakout structure, maintaining price action above the underlying purple ascending trendline and lower black horizontal support floors remains the most critical factor.
$BTC
$ZEC
$XRP