

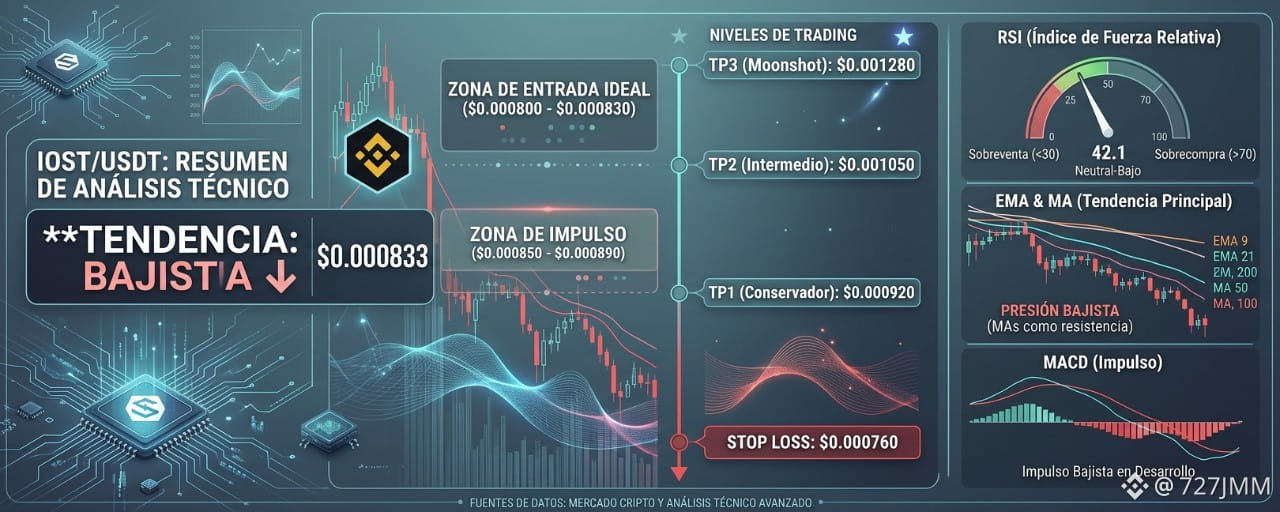


Technical analysis of the IOST/USDT pair ($0.000833), with rigorous risk management amid a bearish consolidation structure.
Ideal Entry Zone: $0.000800 - $0.000830
Momentum Zone: $0.000850 - $0.000890
Trading Levels:
TP1 (Conservative): $0.000920 (Initial target to secure profits after a rebound).
TP2 (Intermediate): $0.001050 (Key target based on the next resistance level).
TP3 (Moonshot): $0.001280 (Extended target in the event of a trend reversal).
Stop Loss: $0.000760 (Strict technical invalidation limit).
RSI: It stands at 42.1 (on a 0–100 scale), below the midpoint (50). This reflects clear selling dominance without yet entering extreme oversold territory (<30), suggesting further downside potential before projecting a sustained rebound.
EMA and MA: The EMAs (9, 21) are positioned below the MAs (50, 100) and the EMA 200, acting as immediate dynamic resistance and confirming the alignment of the main downtrend over the medium term.
MACD: The MACD line is trading below the signal line, with a slightly negative histogram. With no confirmed bullish crossover, the indicator reflects a loss of buying momentum and calls for caution before attempting a structural recovery.