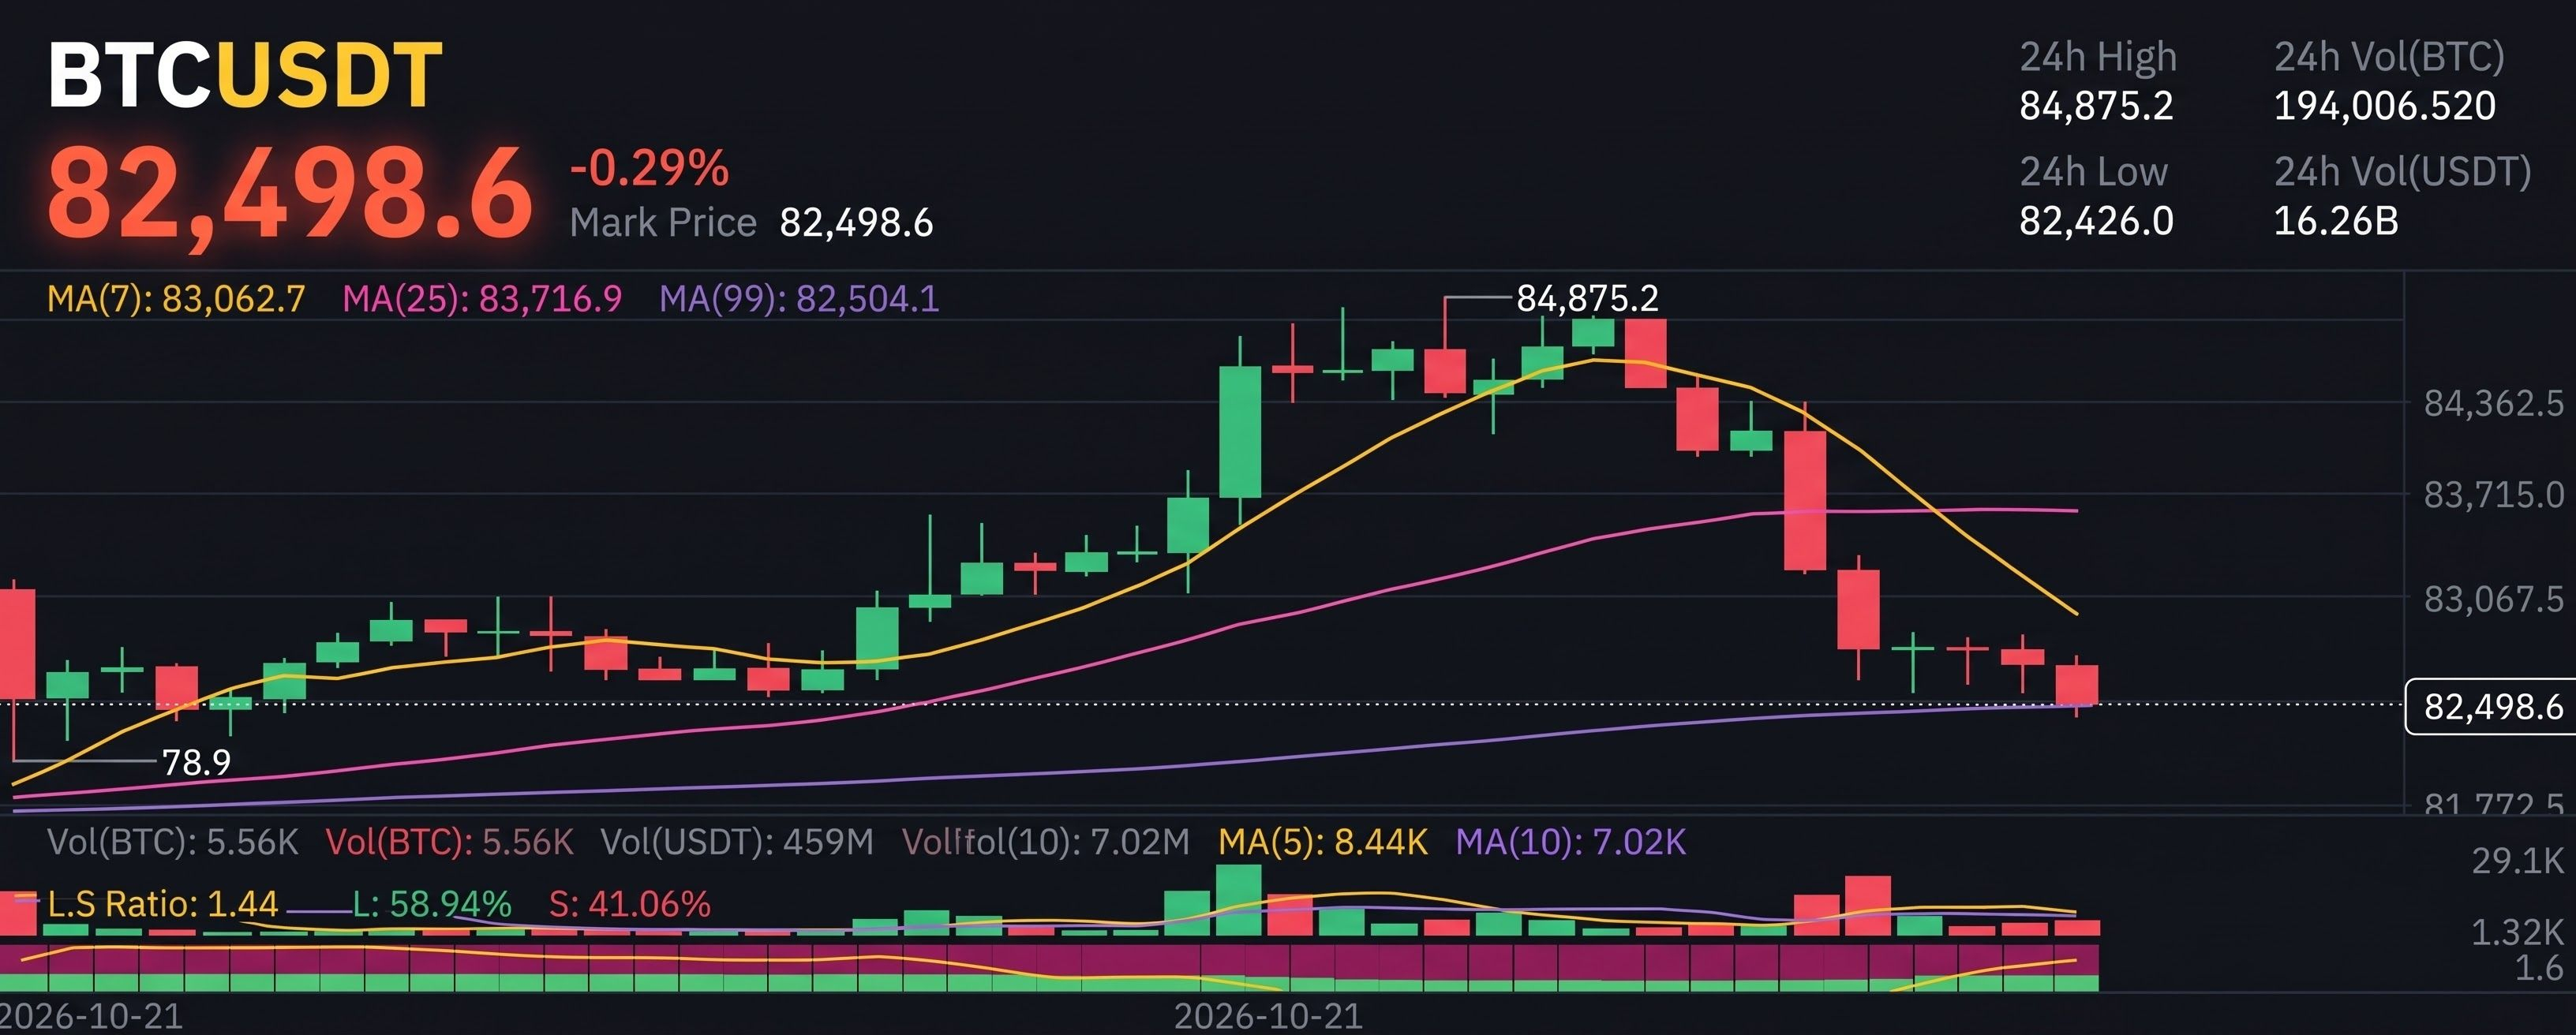

The weekend rally hit a brick wall! Let’s analyze this sudden drop using pure chart math 🧮👇
(Rejection at $84.8K) - (spot buying volume) = BTC drops below $84,000 📉
Here’s the exact equation driving this pullback:
Technical setup:
(24-hour high: $84,875) ➔ Intense profit-taking causes a sharp pullback
Main battlefield:
(Set price: $82,498) ≈ 1-hour moving average support (99) ($82,504) 🛡️
Breakdown details:
After surging toward $85,000, Bitcoin faced heavy resistance at $84,875, triggering consecutive red hourly candles and pushing the price below the $83,000 range.
The market is now testing a crucial trendline support. The 99-period moving average on the 1-hour chart, around $82,500, is currently the bulls’ last line of defense. With the long-to-short ratio holding at 1.44 (58.9% long positions), a decisive drop below $82.4K could quickly target liquidity down to $81,700.
Is this just a healthy retest of support, or are we heading back below $80K? Let’s discuss in the comments! 👇💬
Leave a like and share your opinion with us 🤍