$ETH
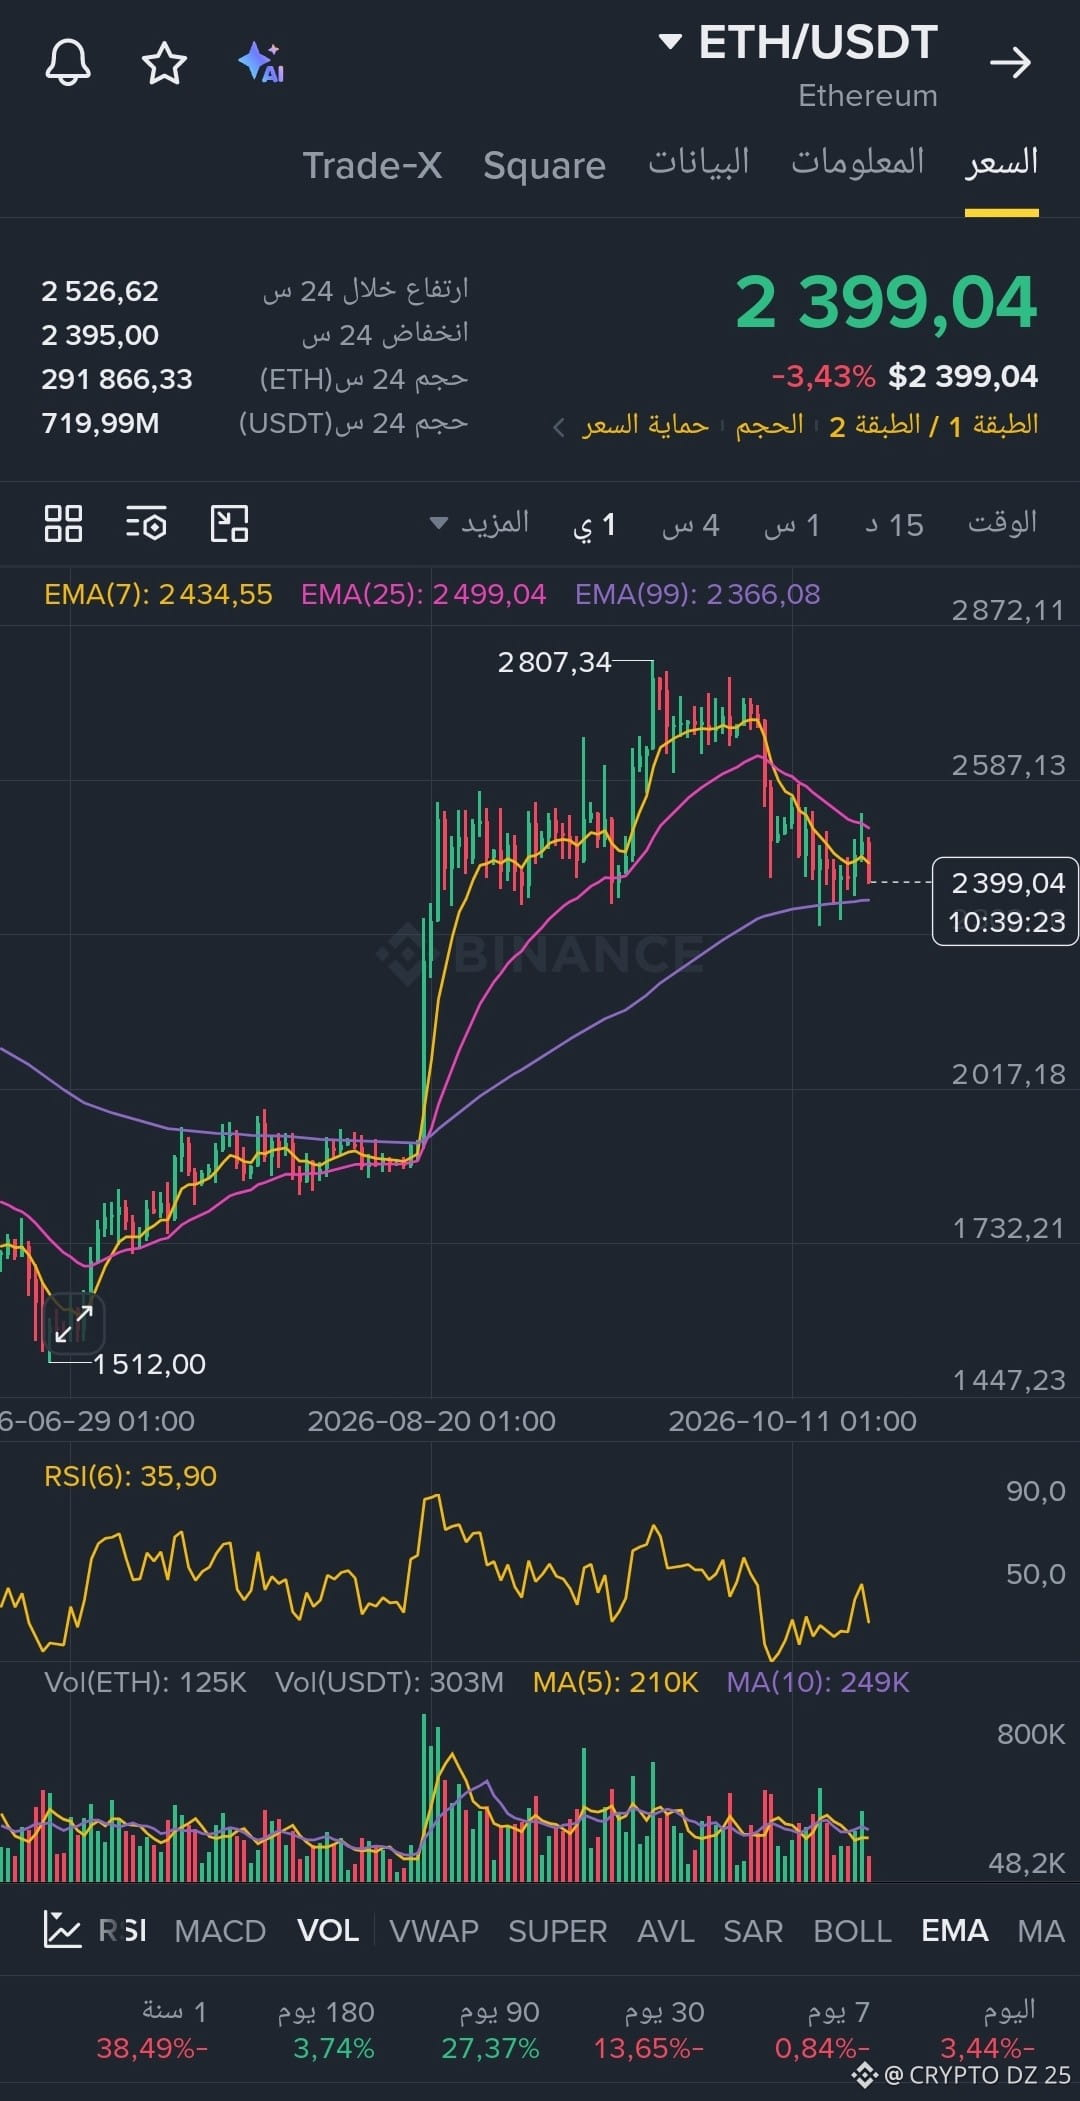
· Current price: $2,399, down 3.43% on the day.
· Overall trend: A clear short-term downward correction. The price has fallen below the fast moving averages (EMA 7 and 25), but remains stable above the slower moving average (EMA 99).
· Relative Strength Index (RSI): The reading is 35.9, approaching the oversold zone. This suggests that the price may be nearing an area where an upward corrective bounce could occur.
· Support and resistance:
· Key support: The moving average (EMA 99) around $2,366. Holding above it is very important to prevent further declines.
· Resistance: A move back above $2,434 (EMA 7) is needed to regain momentum.
· Trading volume: Trading volume has declined along with the price, indicating weakening selling momentum.
Summary: Ethereum is in a corrective downtrend, but is testing an important support area (EMA 99) as the RSI approaches oversold territory. A rebound from this level is possible, but a break below support could pave the way for a deeper decline.
$BTC $SOL