ETH up 28% over 90 days, BTC up 27%: the so-called "ETH underperformed" claim only holds after September 12
1. Image facts
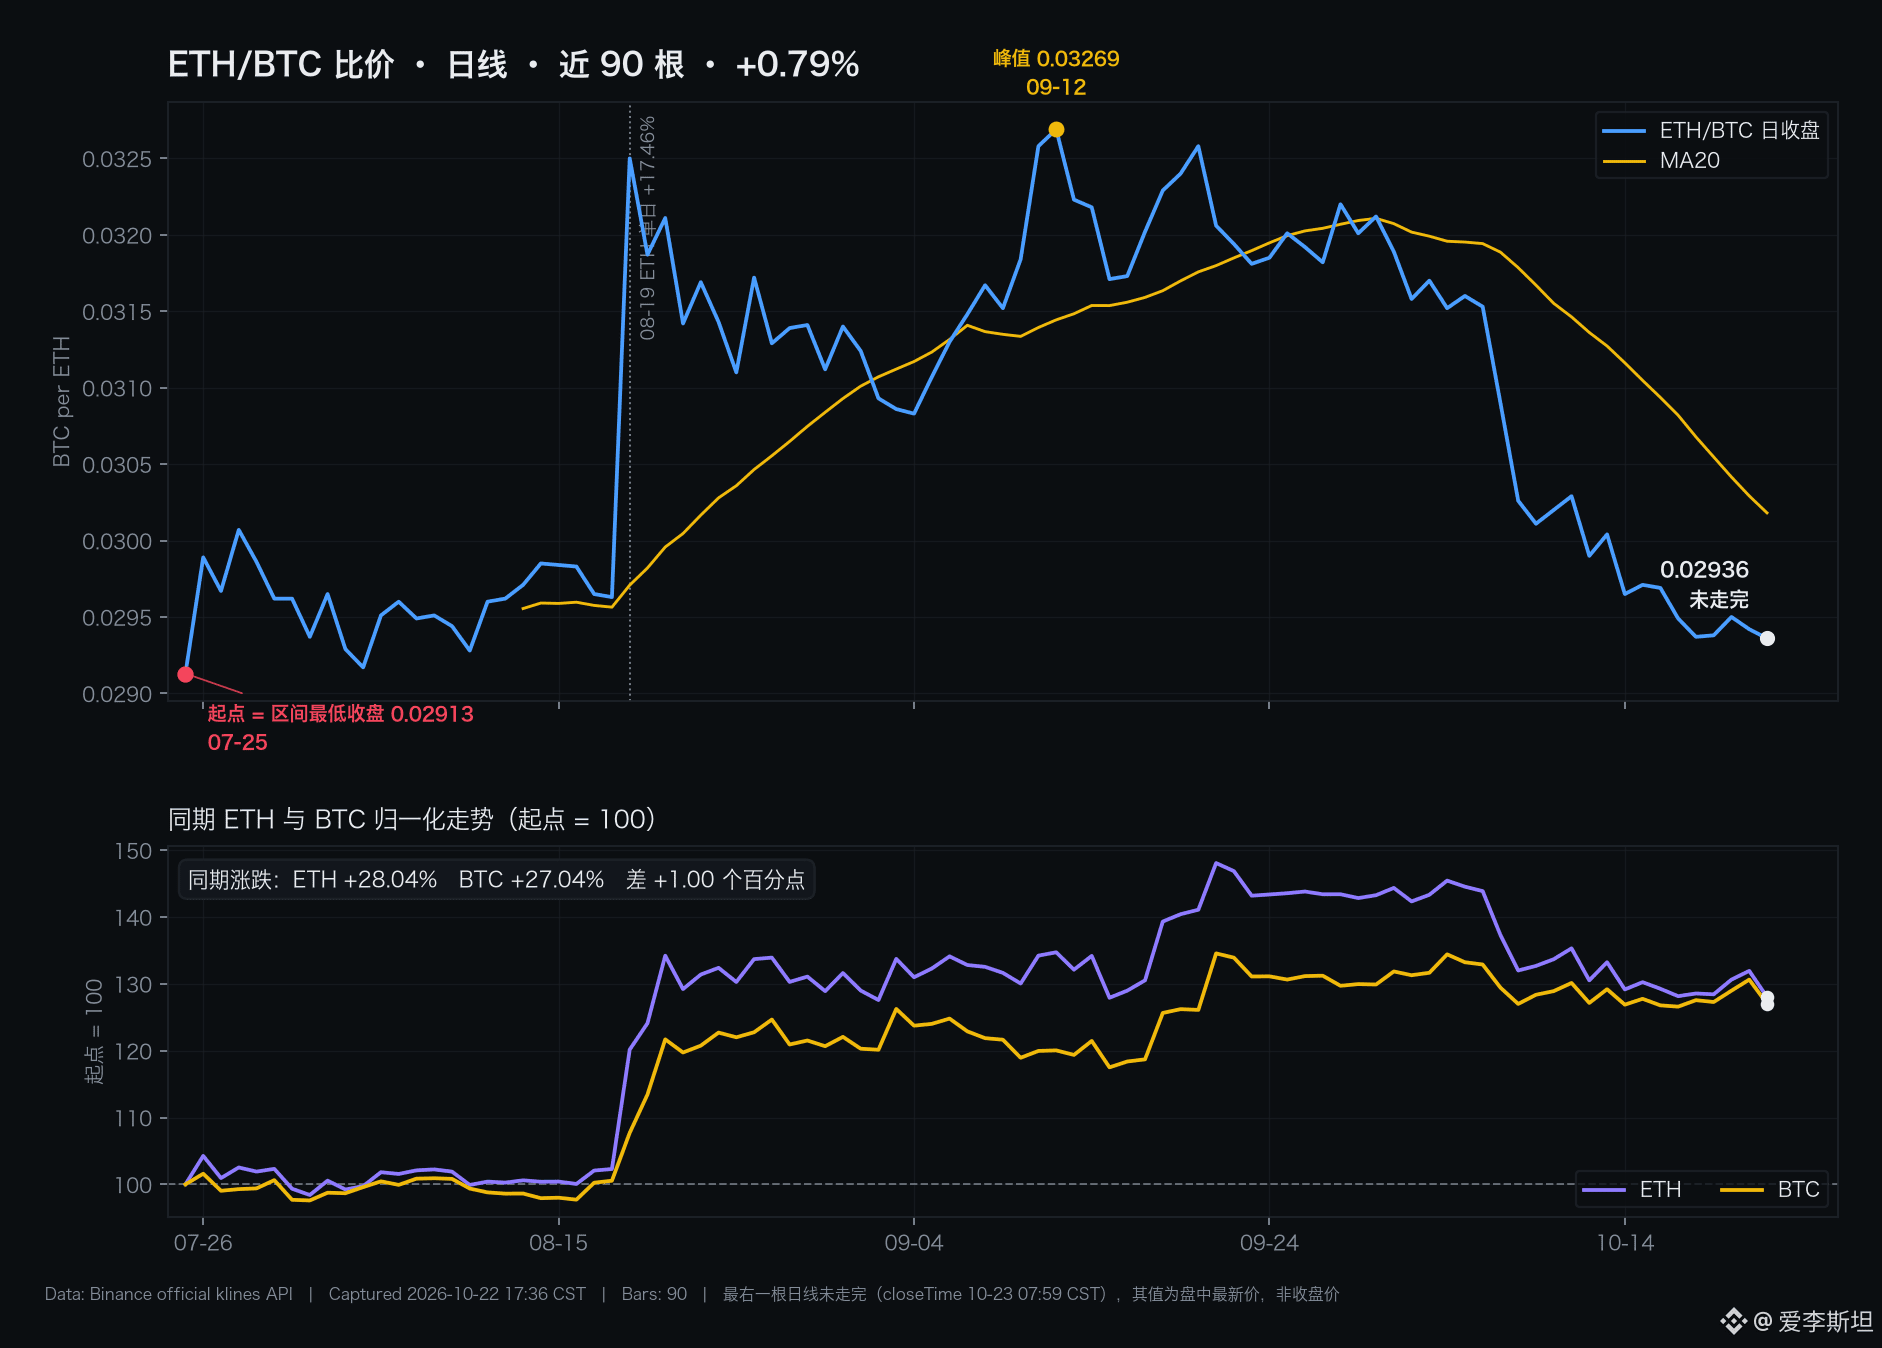
The chart above shows the daily closing ratio of ETH/BTC over 90 candles, from 2026-07-25 to 2026-10-22, with the yellow line being the 20-day moving average. The chart below shows ETH and BTC over the same period, each normalized to a starting point of 100. The data is taken from Binance's official K-line API (ETHBTC interval=1d limit=1000; ETHUSDT and BTCUSDT each interval=1d). A local script reads the raw API values directly for calculation, with no smoothing or interpolation. Screenshot time: 2026-10-22 17:36 (UTC+8). The rightmost daily candle had not yet completed (closeTime 10-23 07:59); the 0.02936 shown on the chart is the latest intraday price, not the closing price.
2. Key evidence
1. Net 90-day change: +0.79%. The 07-25 close was 0.02913, which was also the lowest close in these 90 candles; now it is 0.02936.
2. Both coins rose during the same period, and by nearly the same amount. ETH went from 1,874.89 to 2,400.63, +28.04%; BTC went from 64,375.00 to 81,784.01, +27.04%. The difference is 1.00 percentage point.
3. The turning point was 09-12. From 07-25 to 09-12, the ratio moved from 0.02913 to 0.03269, +12.22%, while ETH rose +34.72% and BTC rose +20.04%. From 09-12 to now, the ratio moved from 0.03269 to 0.02936, -10.19%; in the same period ETH fell -4.96% (2,525.93 to 2,400.63), while BTC rose +5.83% (77,278.73 to 81,784.01).
4. Position. 0.02936 ranks fifth from the bottom among the 90 closing prices, with only 4 candles lower; it is 2.72% below the MA20 of 0.030181 (including the incomplete candle).
3. Market interpretation
Fact: ETH's weakness relative to BTC is not a 90-day trend; it is a six-week pullback that just erased the excess gains from mid-August onward.
Fact: During those six weeks, the two moved in opposite directions — ETH fell 4.96% in absolute terms, while BTC rose 5.83%. The statement "ETH underperformed" is only valid when measured from 09-12 onward; measured over 90 days, it does not hold.
Speculation (not fact): On 08-19, marked by the vertical dashed line in the chart, ETH rose +17.46% in a single day (1,917.85 to 2,252.80), while BTC rose +7.12% that same day, pushing the ratio up 9.69% in one day (0.02963 to 0.03250). The starting point of this ratio rally is there, and the subsequent decline looks more like giving back that excess gain than a systemic abandonment of ETH by capital. To prove this, one would need to see sustained net outflows from ETH spot and net inflows into BTC during the period of ratio decline; this article does not have that data.
4. Reverse checks
There are three limitations. First, "back to 90 days ago" does not mean "back to the yearly low": the 2026 intraday low for the ratio was 0.02525 on 06-06, and the current level is still 16.28% above it. Second, the window is manually chosen; if you switch to 60 days, the ratio moved from 0.03169 to 0.02936, which is -7.35%, and the same chart can also be described as "clearly underperforming." Third, the ratio only measures relative strength and says nothing about capital flow; it lacks spot net inflow data for ETH and BTC, ETF subscriptions/redemptions, and on-chain transfer data.
Evidence that could overturn this judgment: if the ETHBTC daily close falls below 0.02913, then "back to the starting point" becomes "a new 90-day low," and the pullback explanation would need to be revised.
5. What to watch next
One level: can the ETHBTC daily close hold above 0.02913? If it closes above that level, the current move is just a return to the lower edge of the range; if it closes below, the 90-day net change turns negative, and it would be the first close at a new low in these 90 candles. Also watch MA20 (0.030181) — if it cannot reclaim that level, the downtrend structure in the ratio has not ended.
Sources:
https://api.binance.com/api/v3/klines?symbol=ETHBTC&interval=1d&limit=1000
https://api.binance.com/api/v3/klines?symbol=ETHUSDT&interval=1d&limit=90
https://www.binance.com/zh-CN/trade/ETH_BTC
Data collection and screenshot: 2026-10-22 17:33—17:36 (UTC+8)
$ETH $BTC #ETH #BTC #比价 #market data
1. Image facts
The chart above shows the daily closing ratio of ETH/BTC over 90 candles, from 2026-07-25 to 2026-10-22, with the yellow line being the 20-day moving average. The chart below shows ETH and BTC over the same period, each normalized to a starting point of 100. The data is taken from Binance's official K-line API (ETHBTC interval=1d limit=1000; ETHUSDT and BTCUSDT each interval=1d). A local script reads the raw API values directly for calculation, with no smoothing or interpolation. Screenshot time: 2026-10-22 17:36 (UTC+8). The rightmost daily candle had not yet completed (closeTime 10-23 07:59); the 0.02936 shown on the chart is the latest intraday price, not the closing price.
2. Key evidence
1. Net 90-day change: +0.79%. The 07-25 close was 0.02913, which was also the lowest close in these 90 candles; now it is 0.02936.
2. Both coins rose during the same period, and by nearly the same amount. ETH went from 1,874.89 to 2,400.63, +28.04%; BTC went from 64,375.00 to 81,784.01, +27.04%. The difference is 1.00 percentage point.
3. The turning point was 09-12. From 07-25 to 09-12, the ratio moved from 0.02913 to 0.03269, +12.22%, while ETH rose +34.72% and BTC rose +20.04%. From 09-12 to now, the ratio moved from 0.03269 to 0.02936, -10.19%; in the same period ETH fell -4.96% (2,525.93 to 2,400.63), while BTC rose +5.83% (77,278.73 to 81,784.01).
4. Position. 0.02936 ranks fifth from the bottom among the 90 closing prices, with only 4 candles lower; it is 2.72% below the MA20 of 0.030181 (including the incomplete candle).
3. Market interpretation
Fact: ETH's weakness relative to BTC is not a 90-day trend; it is a six-week pullback that just erased the excess gains from mid-August onward.
Fact: During those six weeks, the two moved in opposite directions — ETH fell 4.96% in absolute terms, while BTC rose 5.83%. The statement "ETH underperformed" is only valid when measured from 09-12 onward; measured over 90 days, it does not hold.
Speculation (not fact): On 08-19, marked by the vertical dashed line in the chart, ETH rose +17.46% in a single day (1,917.85 to 2,252.80), while BTC rose +7.12% that same day, pushing the ratio up 9.69% in one day (0.02963 to 0.03250). The starting point of this ratio rally is there, and the subsequent decline looks more like giving back that excess gain than a systemic abandonment of ETH by capital. To prove this, one would need to see sustained net outflows from ETH spot and net inflows into BTC during the period of ratio decline; this article does not have that data.
4. Reverse checks
There are three limitations. First, "back to 90 days ago" does not mean "back to the yearly low": the 2026 intraday low for the ratio was 0.02525 on 06-06, and the current level is still 16.28% above it. Second, the window is manually chosen; if you switch to 60 days, the ratio moved from 0.03169 to 0.02936, which is -7.35%, and the same chart can also be described as "clearly underperforming." Third, the ratio only measures relative strength and says nothing about capital flow; it lacks spot net inflow data for ETH and BTC, ETF subscriptions/redemptions, and on-chain transfer data.
Evidence that could overturn this judgment: if the ETHBTC daily close falls below 0.02913, then "back to the starting point" becomes "a new 90-day low," and the pullback explanation would need to be revised.
5. What to watch next
One level: can the ETHBTC daily close hold above 0.02913? If it closes above that level, the current move is just a return to the lower edge of the range; if it closes below, the 90-day net change turns negative, and it would be the first close at a new low in these 90 candles. Also watch MA20 (0.030181) — if it cannot reclaim that level, the downtrend structure in the ratio has not ended.
Sources:
https://api.binance.com/api/v3/klines?symbol=ETHBTC&interval=1d&limit=1000
https://api.binance.com/api/v3/klines?symbol=ETHUSDT&interval=1d&limit=90
https://www.binance.com/zh-CN/trade/ETH_BTC
Data collection and screenshot: 2026-10-22 17:33—17:36 (UTC+8)
$ETH $BTC #ETH #BTC #比价 #market data