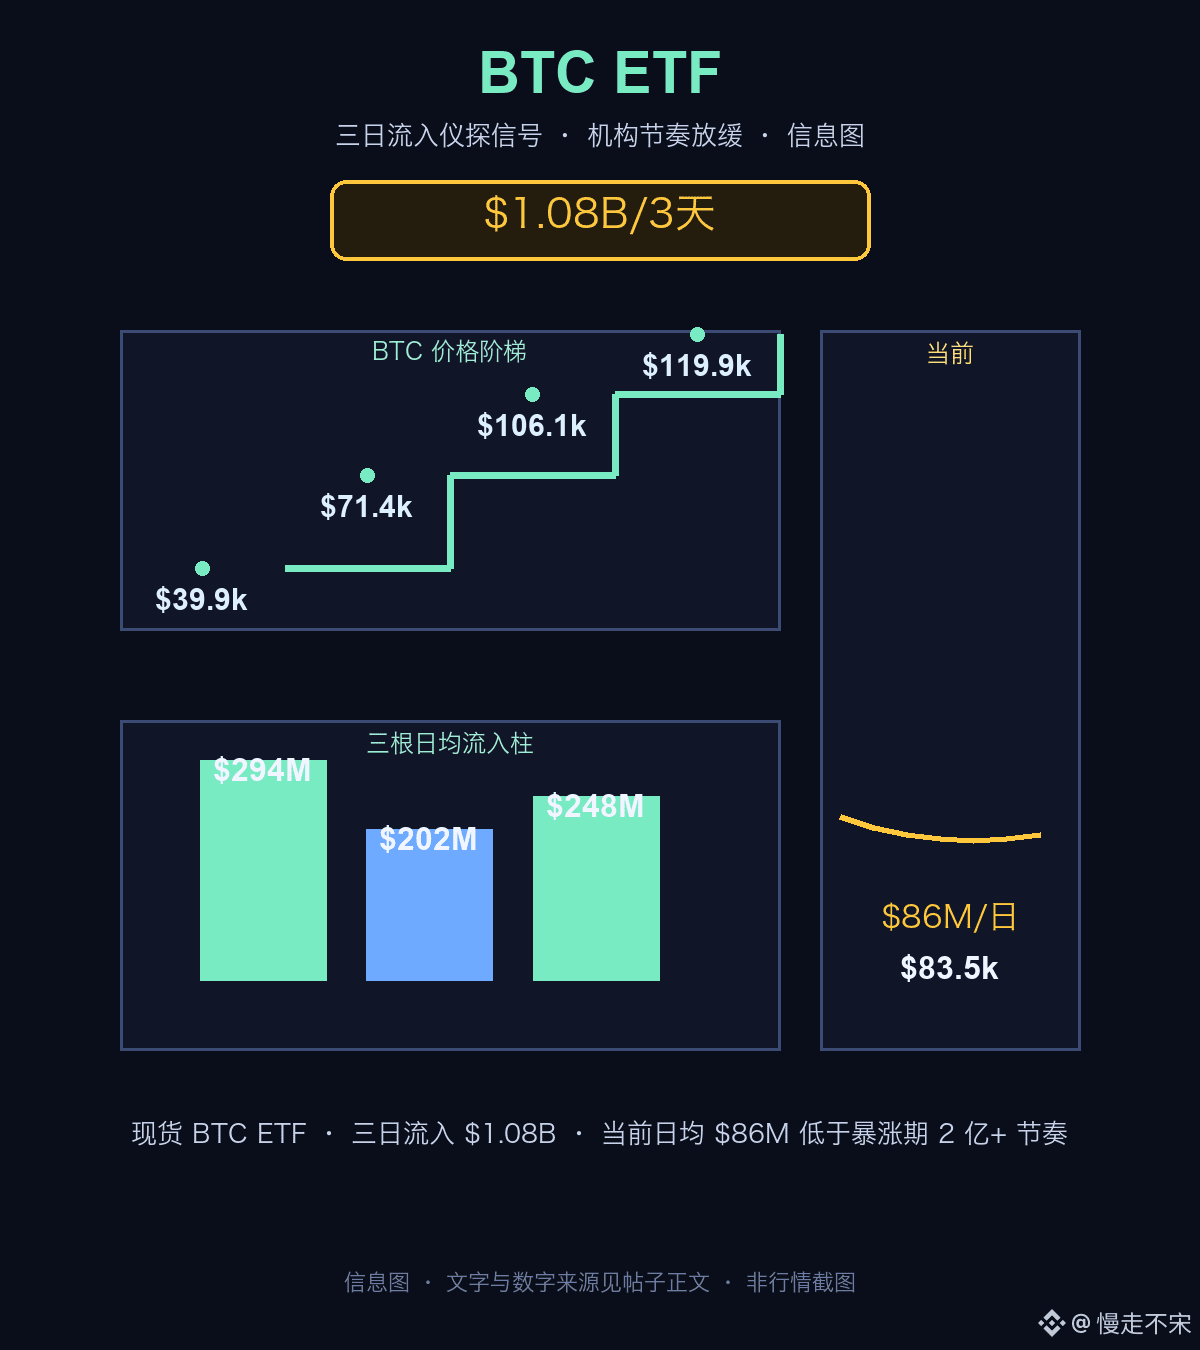
Institutions are testing the waters again, but they haven’t gone all in. U.S. spot Bitcoin ETFs saw more than $1 billion in inflows ($1.08B) over three days this week, a tentative sign that institutional buying may be returning, according to analysts. Giottus CEO Vikram Subburaj offered a measured take: flows remain volatile, and sustained inflows are needed to confirm a stronger recovery.
The historical context makes the picture clearer: since January 2024, all three of BTC’s steep rallies coincided with average daily net inflows above $200 million. Across the three periods, there were 199 trading days with $46.7 billion in net inflows in total—an average of about $235 million per day. Inflows exceeded $500 million on 39 days and $1 billion on 6 days. The three periods were: Jan. 23–Mar. 14, 2024, up 79% ($39.9k→$71.4k, average daily inflow $294M); Aug. 5–Dec. 17, 2024, up 96% ($54.1k→$106.1k, average daily inflow $202M); and Apr. 6–Jul. 14, 2025, up 53% ($78.4k→$119.9k, average daily inflow $248M).
Compare that with the current run: since July 1, BTC is up 39% (about $60k→$83.5k), but average daily net inflows are only about $86 million. Days with inflows above $500 million have come roughly once every 11 trading days (compared with about once every 5 days during the surges), and not a single day has topped $1 billion.
The conclusion is plain: to repeat history with another steep leg upward, daily inflows would need to stay consistently above $200 million. Of course, other channels—such as futures or direct spot buying—can also push prices higher. History is a guide, not a promise.
At the time of publication, BTC was around $84,459, up 2.07%.
#BTC #比特币ETF #Institutions