



Distinguish the breakout level, the low of the breakout candle, and the entire pullback. Don’t use deeper support as a reason to delay your stop-loss.
The price breaks out and then quickly falls back, and there are still several support levels below. Which one should you wait for?
The easy mistake to make is this: you originally planned to exit when the first support gave way, but after it breaks, you put your hope at a lower level. The more reference points you draw on the chart, the farther away the exit condition becomes.
In this lesson, I want to use a real BTC trend to distinguish clearly between two different judgments: the basis for this breakout has been damaged, and the larger rebound may still have support deeper in the move.
First, note the three markers on the chart: L is the low where this rebound began; B is the breakout bar that opened at 00:00 and closed at 04:00 on February 26; R is the area where the lows of three earlier bars cluster. Each four-hour bar records the opening, highest, lowest, and closing prices for those four hours. The volume bar below shows the amount of BTC traded.#BTC
This article uses Binance BTCUSDT USDT-margined perpetual trade-price candles. All times are UTC+8, and prices are in USDT. This is a retrospective teaching example; when examining each stage, use only data from bars that had closed by then.
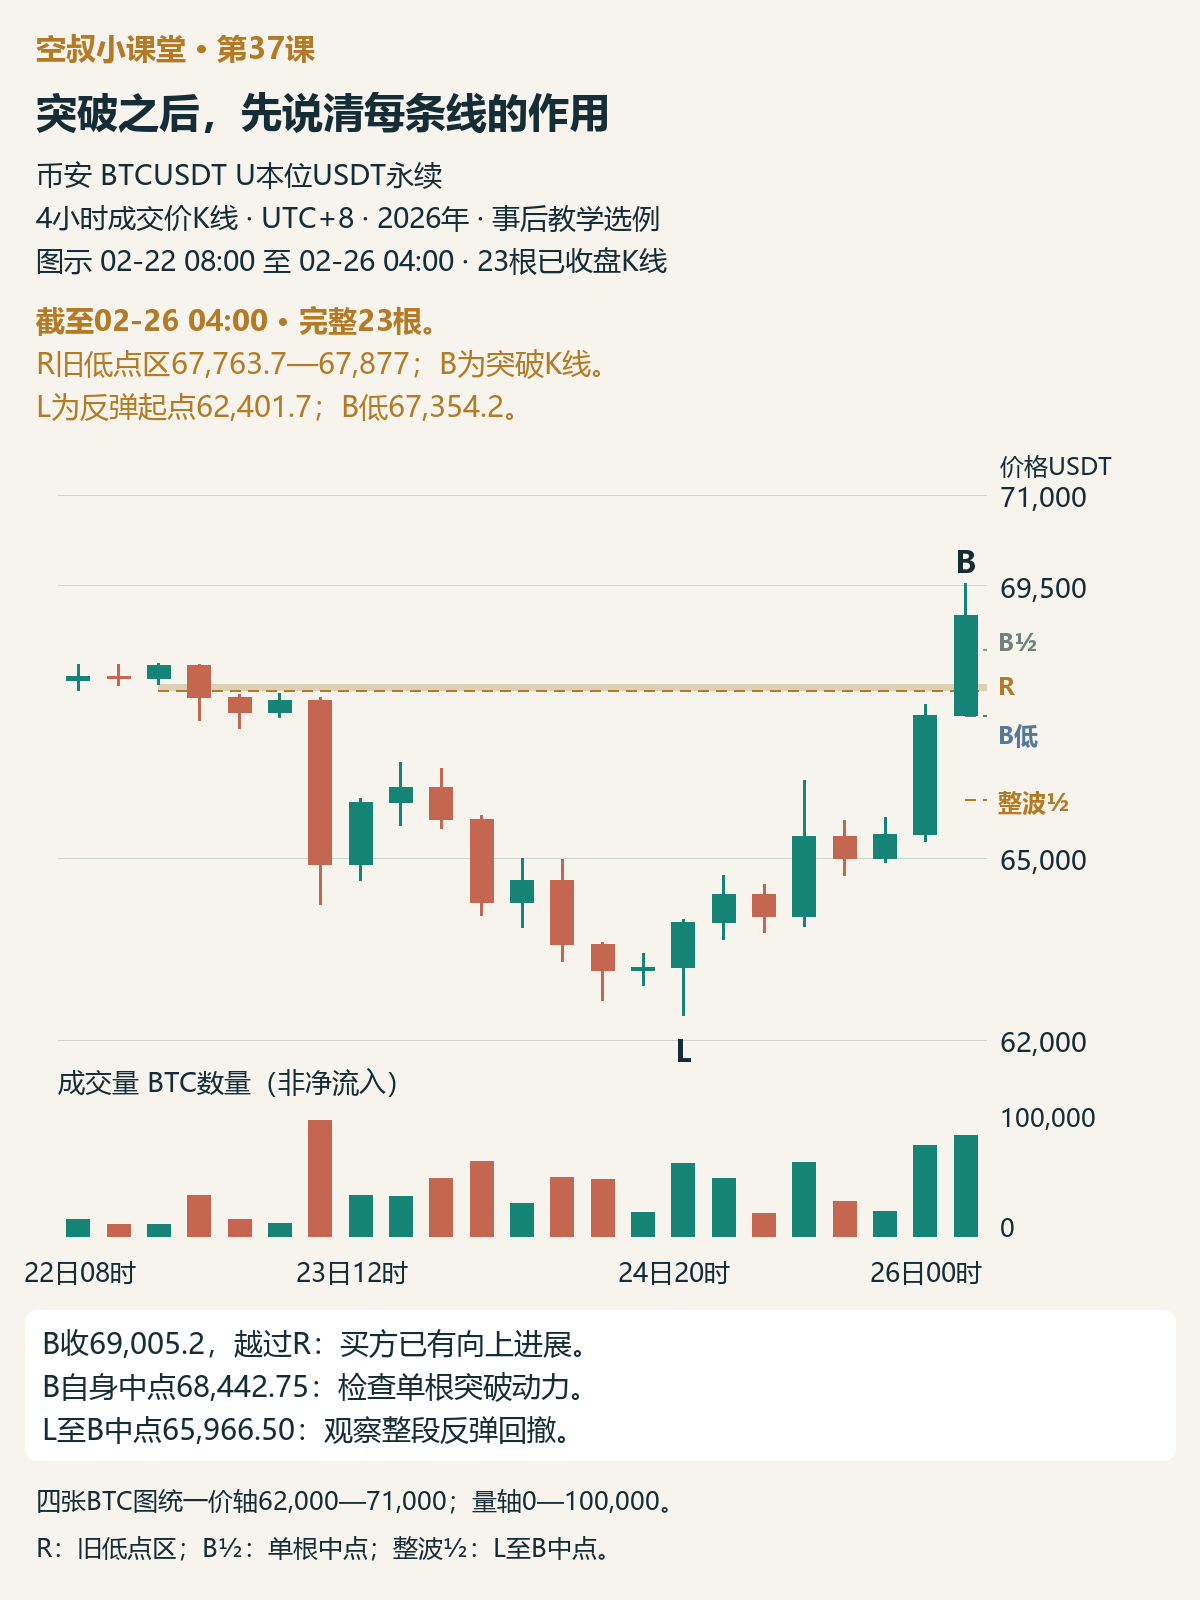
Figure 1 | First locate the rebound’s starting point L, breakout bar B, and former-low area R. Through 04:00 on February 26, 2026: 23 four-hour bars in total. B½ and Full-move ½ denote the single-bar and full-move midpoints, respectively; each is calculated below.
The breakout had already made progress. Why wait for a pullback?
The lows of the first three bars on the 22nd clustered around 67,764–67,877, forming R. Price then fell below this area and continued lower, until the rebound began at L, 62,401.7.
Two consecutive upward bars on the 25th at 20:00 and the 26th at 00:00 pushed price higher. The second bar, B, closed at 69,005.2, above R, on volume of about 77,200 BTC. By the close of B, the near-term rebound was strong. After the lows rose, consecutive upward pushes closed price above the former-low area, showing that buyers had driven price forward.
The two sharp rises also brought the risk of a pullback. In this example, the plan is to wait for a pullback and see whether downward pressure weakens as price retreats, and whether buyers can push price higher again. Here, “demand” means the force of buyers pushing or supporting price, while “supply” means selling pressure. These are interpretations based on price and volume, not a direct reading of any group’s positions from the volume bars.
Three levels, three questions
The first level is R, which price has just crossed: if price pulls back, will it find support? Support means buyers step in to prevent continued declines after selling pressure appears. Price touching a line does not, by itself, establish support.
In a more complete structure, an area that once supported price is broken, then acts as resistance to a rebound, and is later broken to the upside. An area that has undergone this support-resistance role reversal is called an “ice line.” A post-breakout pullback tests whether it can support price again. In this example, R consists of only three adjacent lows, so the historical evidence is limited. Treat it as a local reference; three bars alone do not confirm a complete ice-line structure.
The second level is B’s low, 67,354.2: does the demand behind the breakout still hold? B was an important bar in pushing price above R. If the decline loses even its low, the advantage shown during the breakout has been damaged. B matters because of its role in this breakout; not every single-bar low is inherently important.
The third level is the midpoint of the full rebound from L to B, 65,966.50: could a deeper pullback create a different opportunity? At this level, volume and each bar’s full high–low range should decline, with downward pressure gradually becoming limited. If volume and the full range expand instead, abandon the deeper-pullback idea. The full range is the high minus the low, including both wicks—not just the distance from open to close.
This layered approach draws on Meng Hongtao’s ice-line trading framework. Separating near-term invalidation from a deeper opportunity into independent plans is the risk-management framework developed for this series. A lower level may still be worth assessing, but it does not keep an already-invalidated plan alive.
Two midpoints—not just one “50%”
First, look at bar B. Its high was 69,531.3 and its low was 67,354.2, so its midpoint is:
B’s midpoint = (69,531.3 + 67,354.2) ÷ 2 = 68,442.75.
This is a level for checking breakout momentum: a retreat from B’s high to here means half of B’s full high–low range has been given back. A deeper retreat signals weakening breakout momentum; it does not mean the entire rebound has failed.
Now look at the full rebound from L to B:
Full-move midpoint = (69,531.3 + 62,401.7) ÷ 2 = 65,966.50.
This is the halfway point of the high–low range of the entire rebound. The two midpoints are far apart because one measures a single bar and the other the full move. This example uses the known high and low as of the cutoff time. Once the endpoints are set, they do not change with later highs or lows.

Figure 2 | Teaching diagram, not actual price action. R, B, and L are defined as in Figure 1. The two midpoints are calculated from this article’s BTC data, and each addresses a different question.
A pullback may find support, but you still need to see whether demand can push price higher again
The near-term waiting plan in this example is: if price returns to the area around R or B’s low, first look for volume and the full range to contract, limiting the downward pressure; then look for demand to resume pushing price higher. If price breaks below B’s low first, cancel the setup. Here, a four-hour close above the high of the previous pullback bar is also used as entry confirmation. That is the execution choice for this example, not a universal threshold that every pullback must meet.
Next, note the two markers in Figure 3: X is the first pullback bar after the breakout; D is the later bar that broke below B’s low.
Although X’s volume decreased, its full high–low range was larger than B’s, and it closed below B’s own midpoint. At this point, first assess whether the breakout’s momentum has weakened; don’t call the pullback safe just because volume declined.
The next three bars had notably less volume and smaller full ranges than X. Price repeatedly recovered near R, indicating support. But closes continued to fluctuate around this area, with no sustained push higher and no close confirmation under the criteria used in this example. The evidence so far suggests that the downward pressure was temporarily limited, but it is not enough to say buyers have regained the ability to drive price the way they did on B.
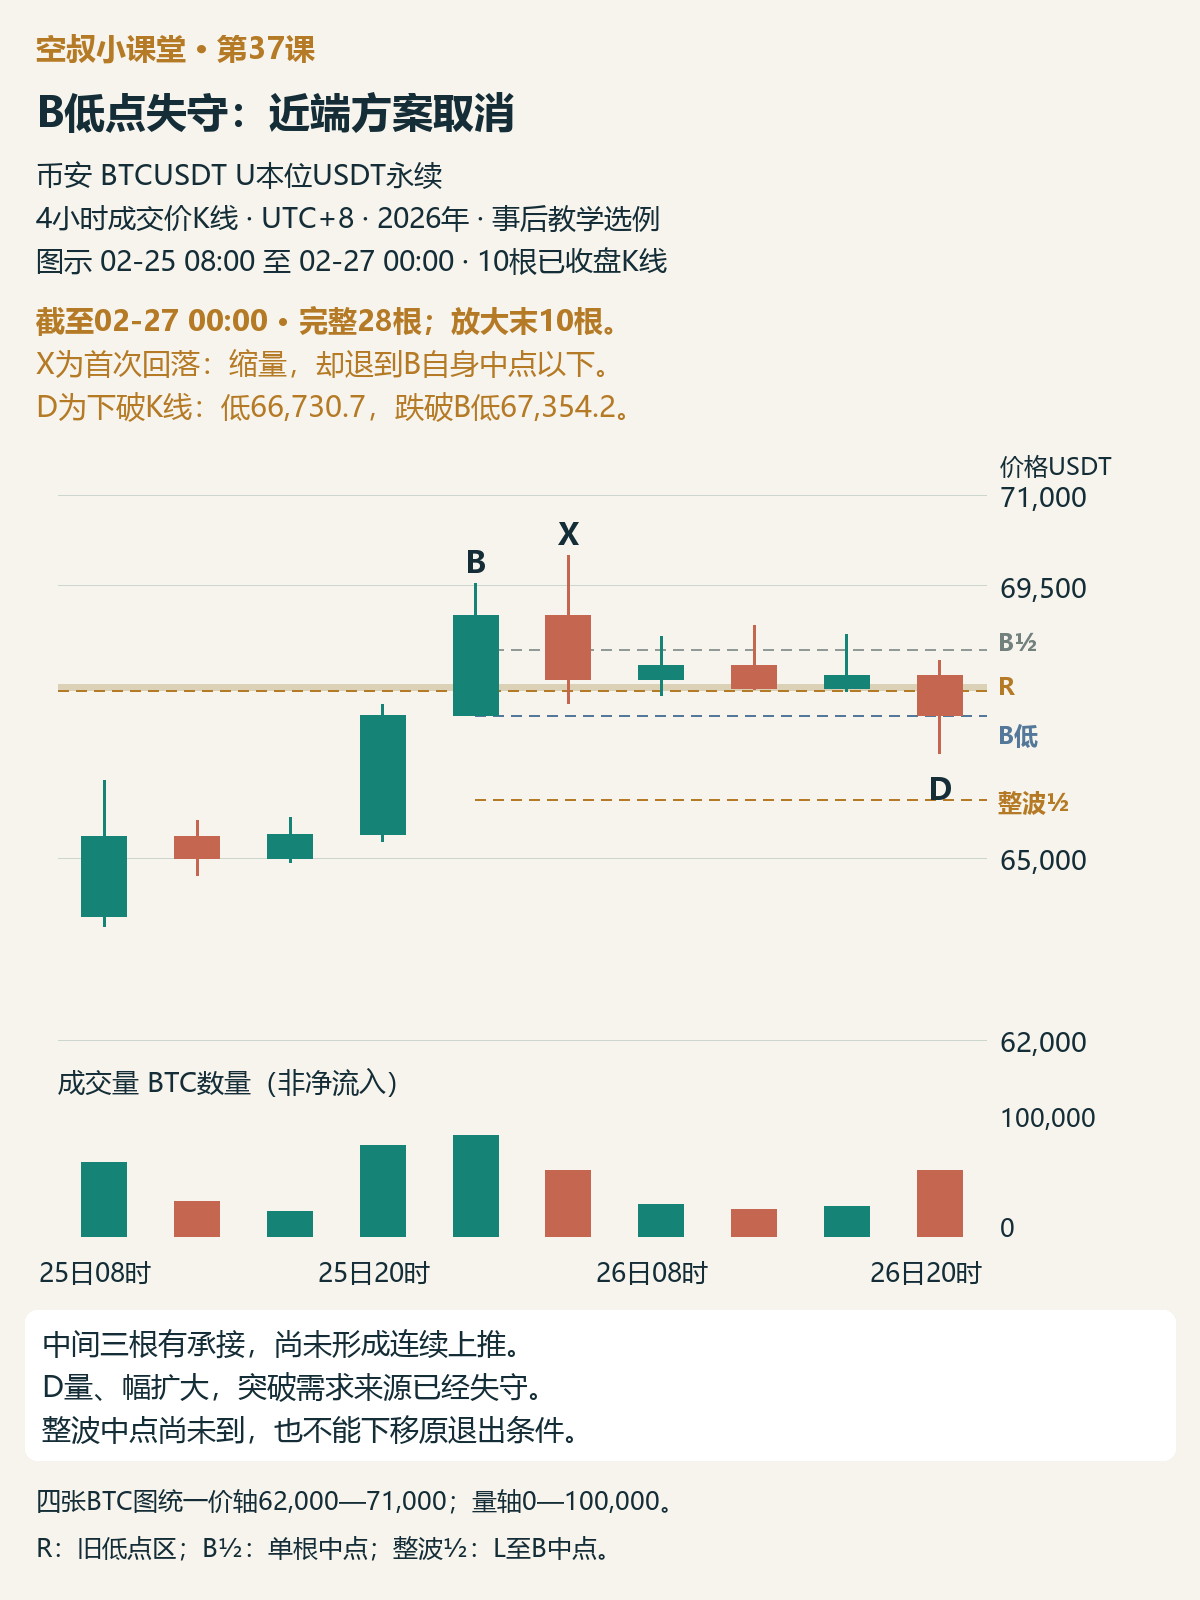
Figure 3 | Through 00:00 on February 27: 28 bars in total, with the last 10 enlarged. X is the first pullback after the breakout; D is the bar that broke below B’s low. The deeper midpoint had not yet been reached.
Once B’s low is lost, act on the near-term setup
D reached a low of 66,730.7, with volume rising to about 50,400 BTC. Compared with the previous bar, both volume and the full range expanded, and price fell intrabar to about $624 below B’s low.
By D, the near-term setup was canceled. Sellers had regained downward progress, and the level where breakout demand had appeared was lost. The fact that the close moved back near B’s low does not erase the decisive intrabar break below it.
At this point, D had not yet reached the midpoint of the full move at 65,966.50. Whether support might appear deeper down can be assessed separately; the near-term basis that has already been lost must be addressed promptly.
For anyone not already in a trade, this means canceling the original opportunity. If a position was opened under a separate execution plan, act when the preset price stop is triggered—don’t wait for higher volume or the close. “There may be support lower down” is not a reason to delay the original exit condition.
Reaching the midpoint does not automatically mean it’s time to buy
After D, price probed lower and recovered, then consolidated sideways. It was not until the bar that opened at 16:00 and closed at 20:00 on February 27 that price reached the area of the full-move midpoint. Figure 4 marks it as F.
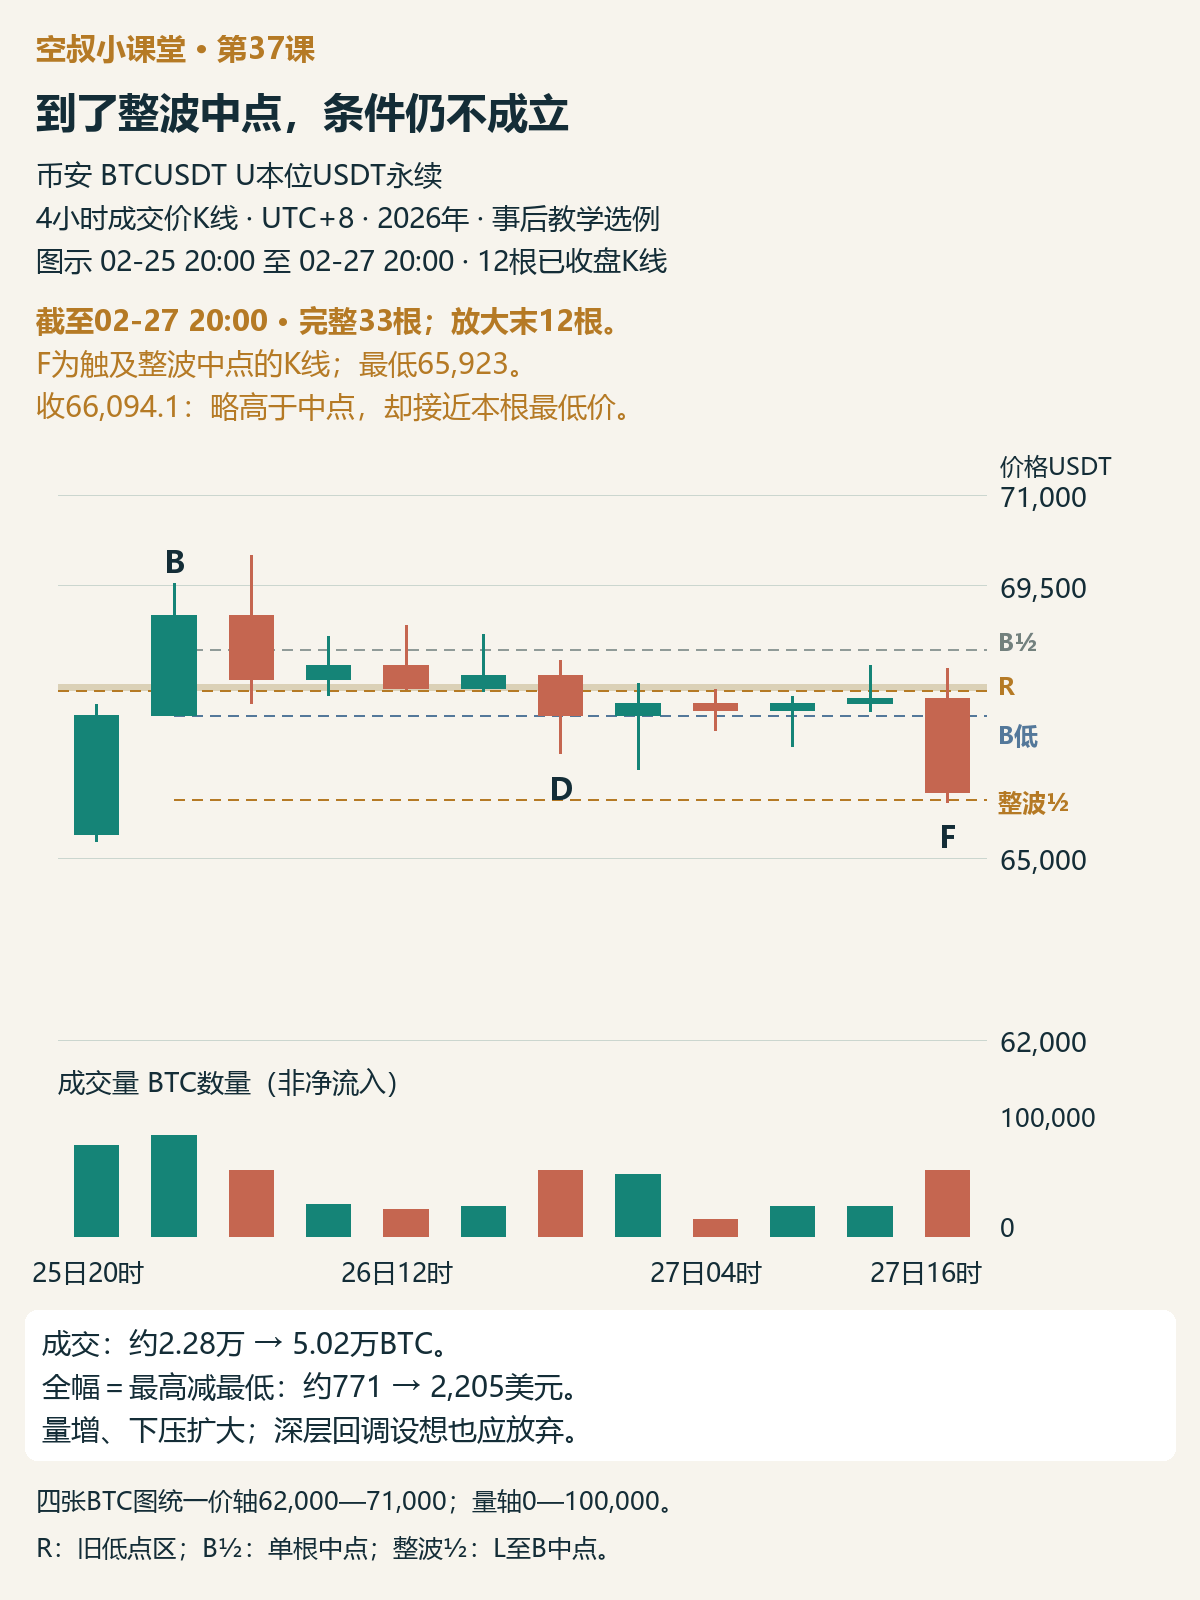
Figure 4 | Through 20:00 on February 27: 33 bars in total, with the last 12 enlarged. F is the bar that touched the deeper midpoint. How price got there matters more than whether it closed marginally above the line.
F reached a low of 65,923 and closed at 66,094.1. Although the close was slightly above the midpoint, the way price got there was not calm: volume rose from about 22,800 BTC on the previous bar to 50,200 BTC, the full range expanded from about $771 to $2,205, and the bar closed near its low.
By F, the idea of participating in a deeper pullback should also be abandoned. The conditions called for declining volume and a narrowing full range, but instead trading became more active, the downward move covered more ground, and the close did not move clearly away from the low. Supply was still making downward progress.
The reason to abandon the setup is that this behavior did not meet the conditions—not that a midpoint line is a universal switch for deciding whether BTC is in a bull or bear market. The level tells us where to check; price and volume behavior determine whether this pullback fits the plan.
What kind of pullback would be different from this failure?
Meng Hongtao discussed a daily-chart example: price was moving within a descending channel, then rebounded quickly after touching the oversold line—the channel’s lower boundary, used to assess whether the decline had been too sharp. The rebound first met resistance at former support. Price then pulled back slightly on low volume for two days, before a strong bar broke through both the resistance and the descending trendline. The breakout had strength, but the rapid rise also increased the risk of a pullback.
His plan was to wait for a low-volume pullback to end near support, then consider going long, with the existing overhead resistance as the first target. If price lost the breakout bar’s low, he would reassess at the full-move midpoint; if volume and the full range were not declining there, he would abandon the setup. His view that a drop below the full-move midpoint meant the bear trend had resumed was his interpretation of this example and should not be applied to every market.
Later, in this example, pullback bars closed above the breakout bar’s low, and buyers quickly stopped one dangerous intrabar probe lower. The author interpreted the correction as selling pressure being absorbed, and called a dip below and recovery back near the breakout bar’s own midpoint a Spring, using it as a basis for participation. A Spring can be understood as a probe below support followed by a recovery; not every lower wick qualifies.
This response differs from BTC’s D and F: the key is that downward pressure was stopped, not simply that “price touched a line.” A close above a level does not mean price never pierced it intrabar. Absorption and “safe entry” are the author’s interpretations of the example, not proof of institutional activity or a guarantee of risk-free trading.
Now let’s look at what actually happened next with BTC
In Figure 5, G is the large downward bar that opened at 12:00 on February 28. The gold shading shows price action that occurred only after F closed.
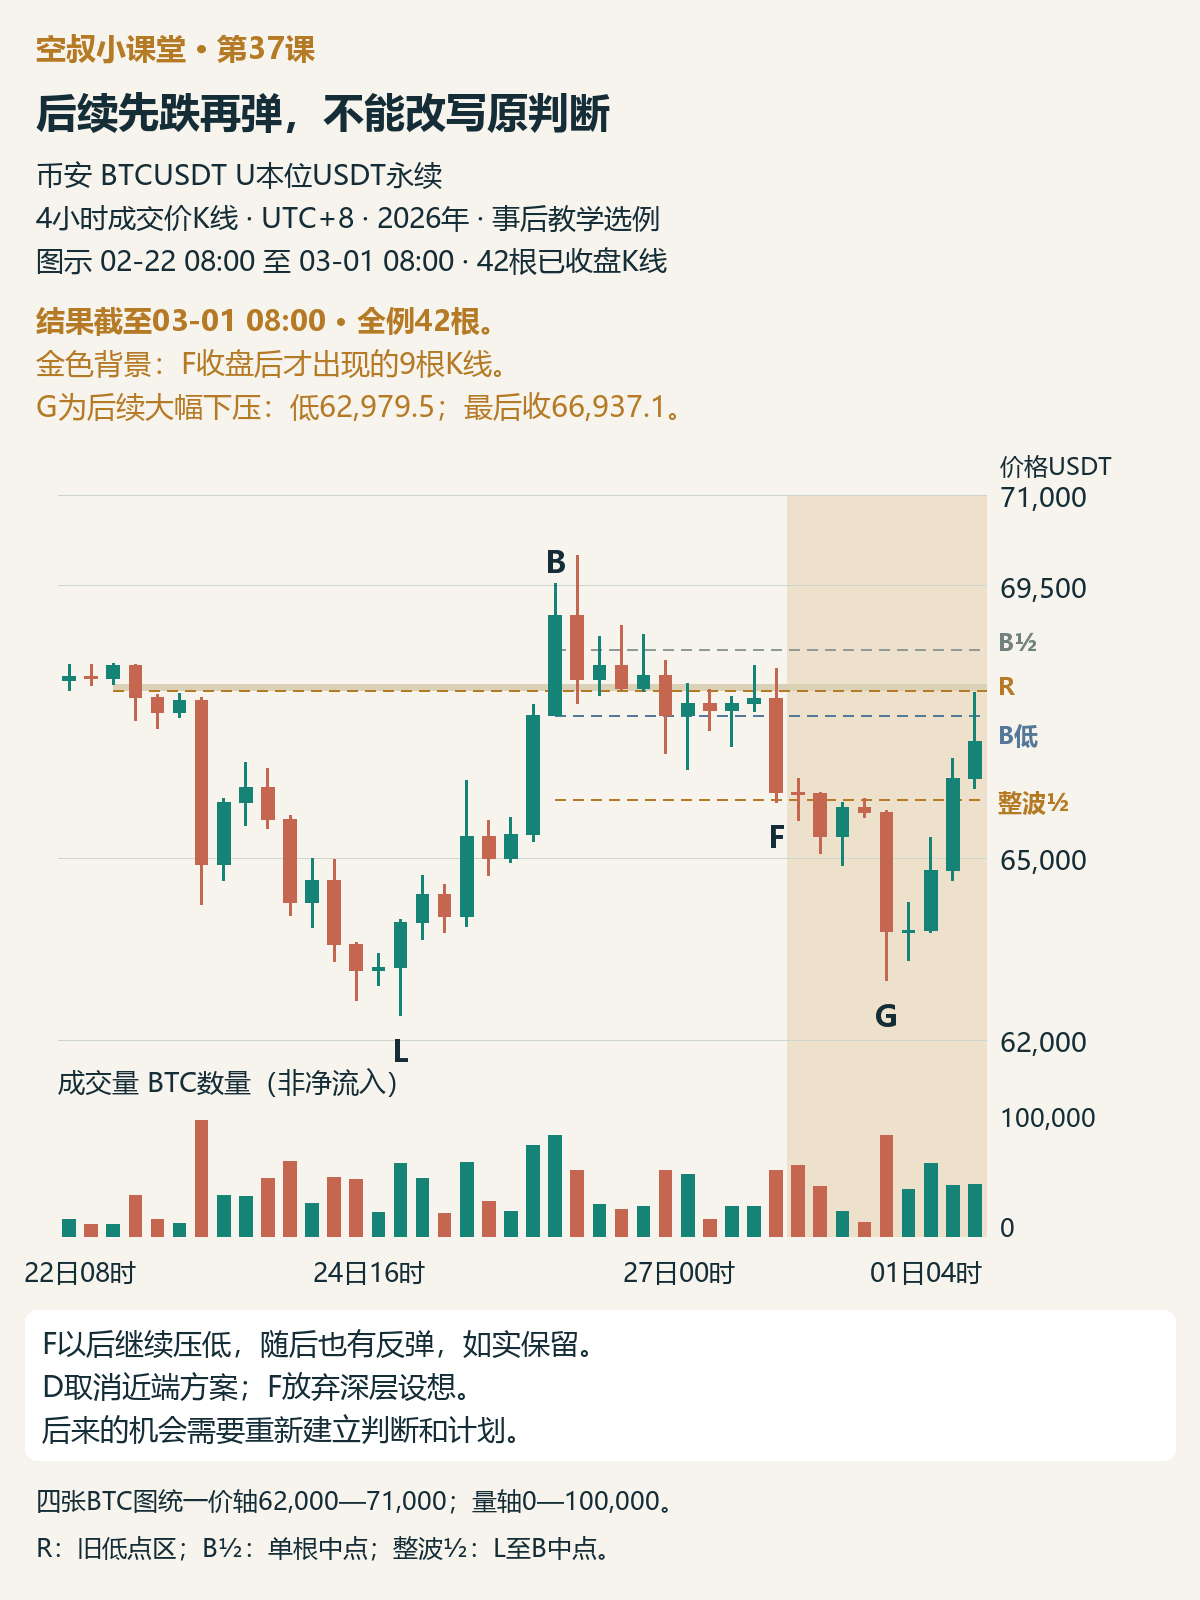
Figure 5 | Subsequent price action through 08:00 on March 1; 42 four-hour bars in total. G reached a low of 62,979.5; a rebound followed, with the final close at 66,937.1.
After F, price continued lower. G reached 62,979.5, giving back a large portion of the entire rebound. Price then rebounded again, closing at 66,937.1 by 08:00 on March 1.
The later rebound did not change the fact that the near-term basis had been damaged at D and the deeper-pullback conditions had not been met at F. A plan that should have been closed based on the evidence available at the time should have been closed promptly. If a new opportunity appears later, reassess and make a new plan.
What I learned
What I want to remember this time is not to draw more lines, but to understand what each one is checking: the breakout area checks for support; the breakout bar’s low checks whether the near-term basis for demand still holds; and the full-move midpoint checks whether a deeper pullback could offer a different opportunity.
The midpoint of a single bar signals a change in momentum; the full-move midpoint provides a deeper level to watch. Support, weakening downward pressure, a return of demand, and the conditions for a complete entry must each be assessed separately. If one layer’s basis fails, act on that layer’s plan; don’t use lower support to delay an exit.
A quick exercise
Look at Figure 3: D has already broken below B’s low but has not yet reached the full-move midpoint. What should happen to the original near-term setup? Why shouldn’t the exit condition be moved down to the full-move midpoint? Then look at Figure 4: F still closed above the midpoint. Why should the idea of participating in a deeper pullback still be abandoned?
Share your reasoning in the comments; don’t just answer “up” or “down.” I’ll add a suggested analysis to the comments on this post later.