

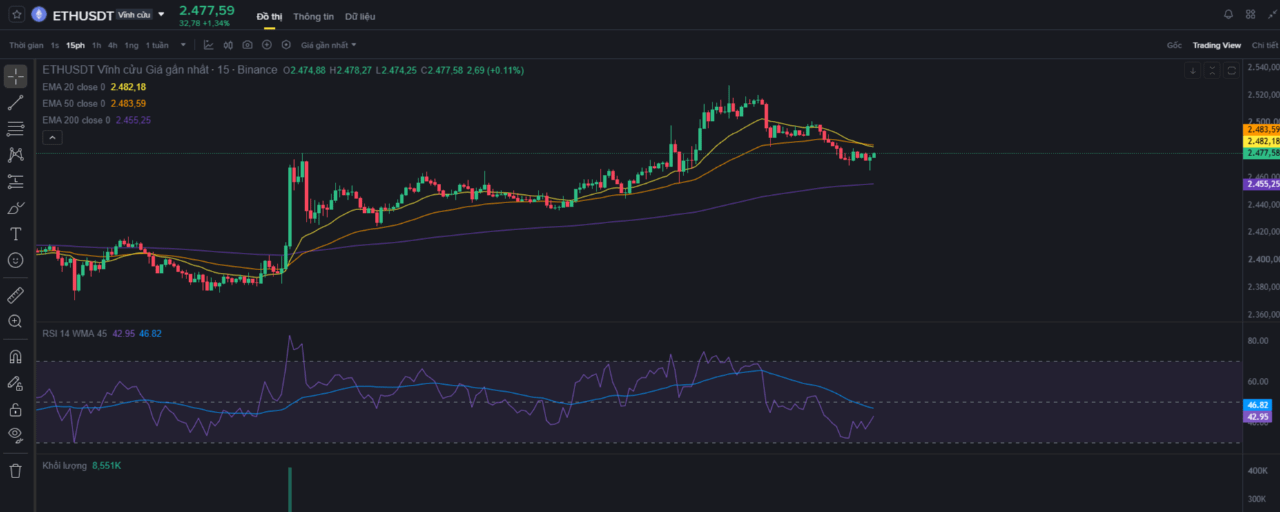

The Ethereum market is entering an important price-compression phase following an impressive recovery from its lows. Applying a tiered structural trading approach helps us distinguish short-term technical pullbacks from trading opportunities aligned with the larger flow of capital.
Below is an in-depth technical analysis and a standardized trading plan for ETH/USDT today.
1. Daily (D) Time Frame — Big-Picture Direction & Trend Positioning
Looking at the broader picture on the Daily timeframe, Ethereum's market structure shows several positive signs:
Trend structure: Following the previous decline, ETH established a solid low and is now in an upward accumulation phase, with each low higher than the previous one.
EMA status: The current price ($2.477,98) is holding firmly above the Daily EMA 200 ($2.308,53)—the critical boundary that defines the long-term trend. Price is currently consolidating tightly and contending just below the EMA 20 ($2.494,26) and EMA 50 ($2.480,43) cluster.
Momentum: The RSI(14) is fluctuating around 46.63. Price consolidation around the neutral 50 level suggests the market is building energy for a new breakout.
Daily timeframe conclusion: BUY Bias / Favor buying. As long as price remains above the Daily EMA 200, the primary strategy is to look for support zones to buy rather than chase the price by selling.
2. H4 Timeframe — Defining the Trading Zone
The H4 timeframe helps us pinpoint where the price may finish its pullback and resume its recovery:
H4 structure: Price has completed a breakout from the previous accumulation base and is now returning to retest the resistance zones it has broken through.
Confluence of support levels:
Price is holding above the H4 EMA 20 ($2.447,01) and EMA 50 ($2.450,09).
Dynamic resistance overhead is at the H4 EMA 200 ($2.506,99).
Identifying the BUY Zone:
Key zone: $2.440–$2.455. This is a valuable technical confluence of the previous accumulation high and the H4 EMA 20/50 cluster.
TP range (Target Space): The potential move from around $2.450$ to retest the previous high/H4 EMA 200 near $2.510–$2.535 offers a very attractive risk-to-reward ratio.
H4 timeframe conclusion: Patiently wait for the price to pull back and test the BUY Zone at $2.440–$2.455.
3. H1 Timeframe — Signal Assessment & Trade Setup
Break down H1 price action to assess actual buying and selling pressure:
Price Action: After reaching $2.530, ETH experienced a technical correction. Price is now moving close to the H1 EMA 20 ($2.477,26) and appears to be cooling toward the H1 EMA 50 ($2.455,79) / EMA 200 ($2.450,64).
Trading volume: Volume on the H1 bearish candles has fallen to very low levels compared with the volume on the preceding breakout green candles. This indicates a short-term profit-taking move (Healthy Pullback), not a lack of demand or a trend reversal.
H1 momentum: The H1 RSI is holding at 53.40 (above 50), confirming that buyers remain in control.
H1 timeframe conclusion: The Buy setup is taking shape. Closely monitor the price reaction when it reaches the H1 EMA 50/200 cluster ($2.450–$2.460).
4. M15 Timeframe — Position Trigger & Risk Management
The M15 timeframe acts as the “final checkpoint” for precise trade execution:
M15 status: Price is undergoing a short-term correction below the M15 EMA 20/50 and approaching the M15 EMA 200 ($2.455,25). The M15 RSI has retreated to 42.95.
Confirmation Trigger: Do not enter a Market order while the price is hovering around the current $2.477 level. Only trigger a Buy order when:
The price falls to the $2.450–$2.460 zone and a rejection candle (Pinbar/Bullish Engulfing) appears.
M15 confirms a higher low (HL) structure and breaks above the nearest minor high.
LIVE TRADING PLAN
Position: BUY / LONG (With the trend)
Entry Watch Zone: $2.450–$2.462
Expected Entry (After M15 confirmation): $2.460–$2.465
Stop Loss (SL): $2.428 (Placed below the entire H1/H4 support cluster and the H1 EMA 200)
Take Profit (TP):
TP1: $2.505 (Test of the H4 EMA 200 resistance)
TP2: $2.535 (Retest of the previous high)
Risk-to-reward ratio: 1:2 to 1:3
