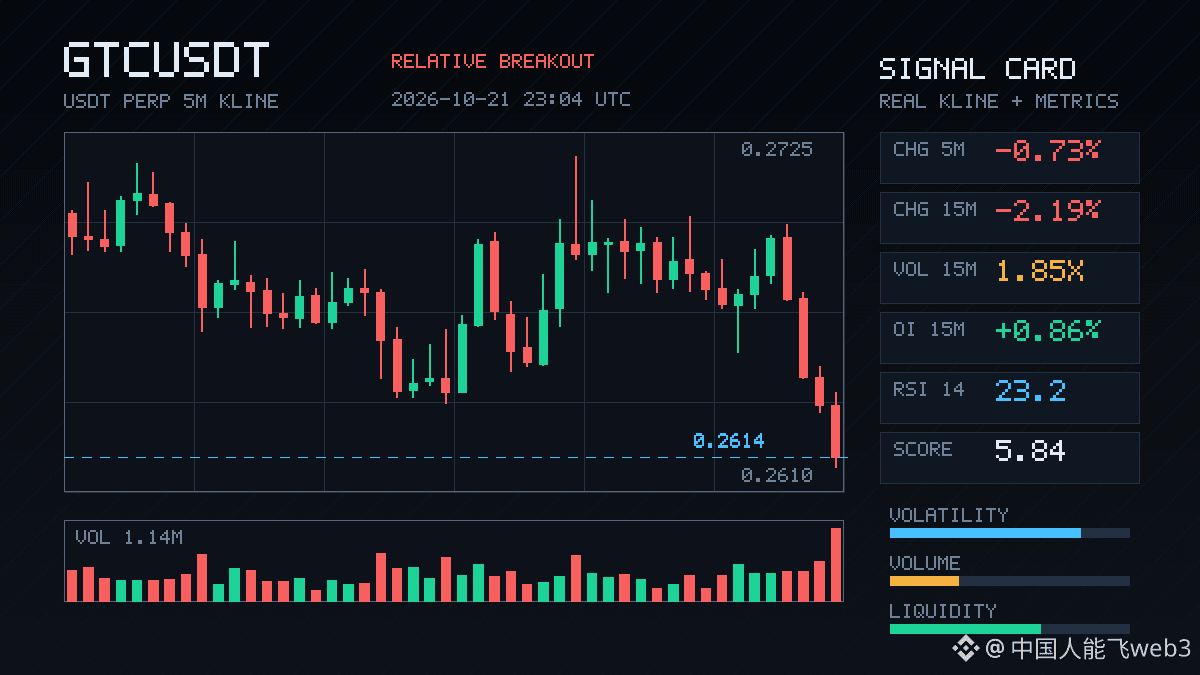
$GTC This 15m move is interesting: the price fell 2.19%, while volume expanded to 1.85x and OI also rose. When the price falls and OI rises along with it, this combination looks more like new shorts continually entering with increased leverage than existing longs panic-selling.
The closing price fell straight below the lower bound of the last 20 5m candles. The taker volume delta was -14.2%, and the buy/sell ratio was 0.75, indicating selling pressure from aggressive traders. The OI anomaly percentile was 65.1%, ranking #20 across the full pool, while the notional change ranked #36. Although it wasn't among the most extreme readings, there was enough confirmation from market depth: volume was above normal, the price touched the boundary of the recent range, and taker flow showed a clear directional bias.
The 24h trading volume was 77M, so liquidity isn't bad. If shorts keep piling in at this level, though, watch out for a potential short squeeze. First, keep an eye on whether the price can reclaim the lower boundary of this range. If it can't, the short-term structure will be tilted to the downside.
The closing price fell straight below the lower bound of the last 20 5m candles. The taker volume delta was -14.2%, and the buy/sell ratio was 0.75, indicating selling pressure from aggressive traders. The OI anomaly percentile was 65.1%, ranking #20 across the full pool, while the notional change ranked #36. Although it wasn't among the most extreme readings, there was enough confirmation from market depth: volume was above normal, the price touched the boundary of the recent range, and taker flow showed a clear directional bias.
The 24h trading volume was 77M, so liquidity isn't bad. If shorts keep piling in at this level, though, watch out for a potential short squeeze. First, keep an eye on whether the price can reclaim the lower boundary of this range. If it can't, the short-term structure will be tilted to the downside.