




AMP is still up more than 130% from its August low, but sharply declining trading volume threatens the sustainability of its recovery.
AMP has moved back above $0.000830 and the moving averages during its second-half 2026 rebound. However, weakening trading activity and high supply concentration make the bullish outlook risky.
MAIN CONTENT
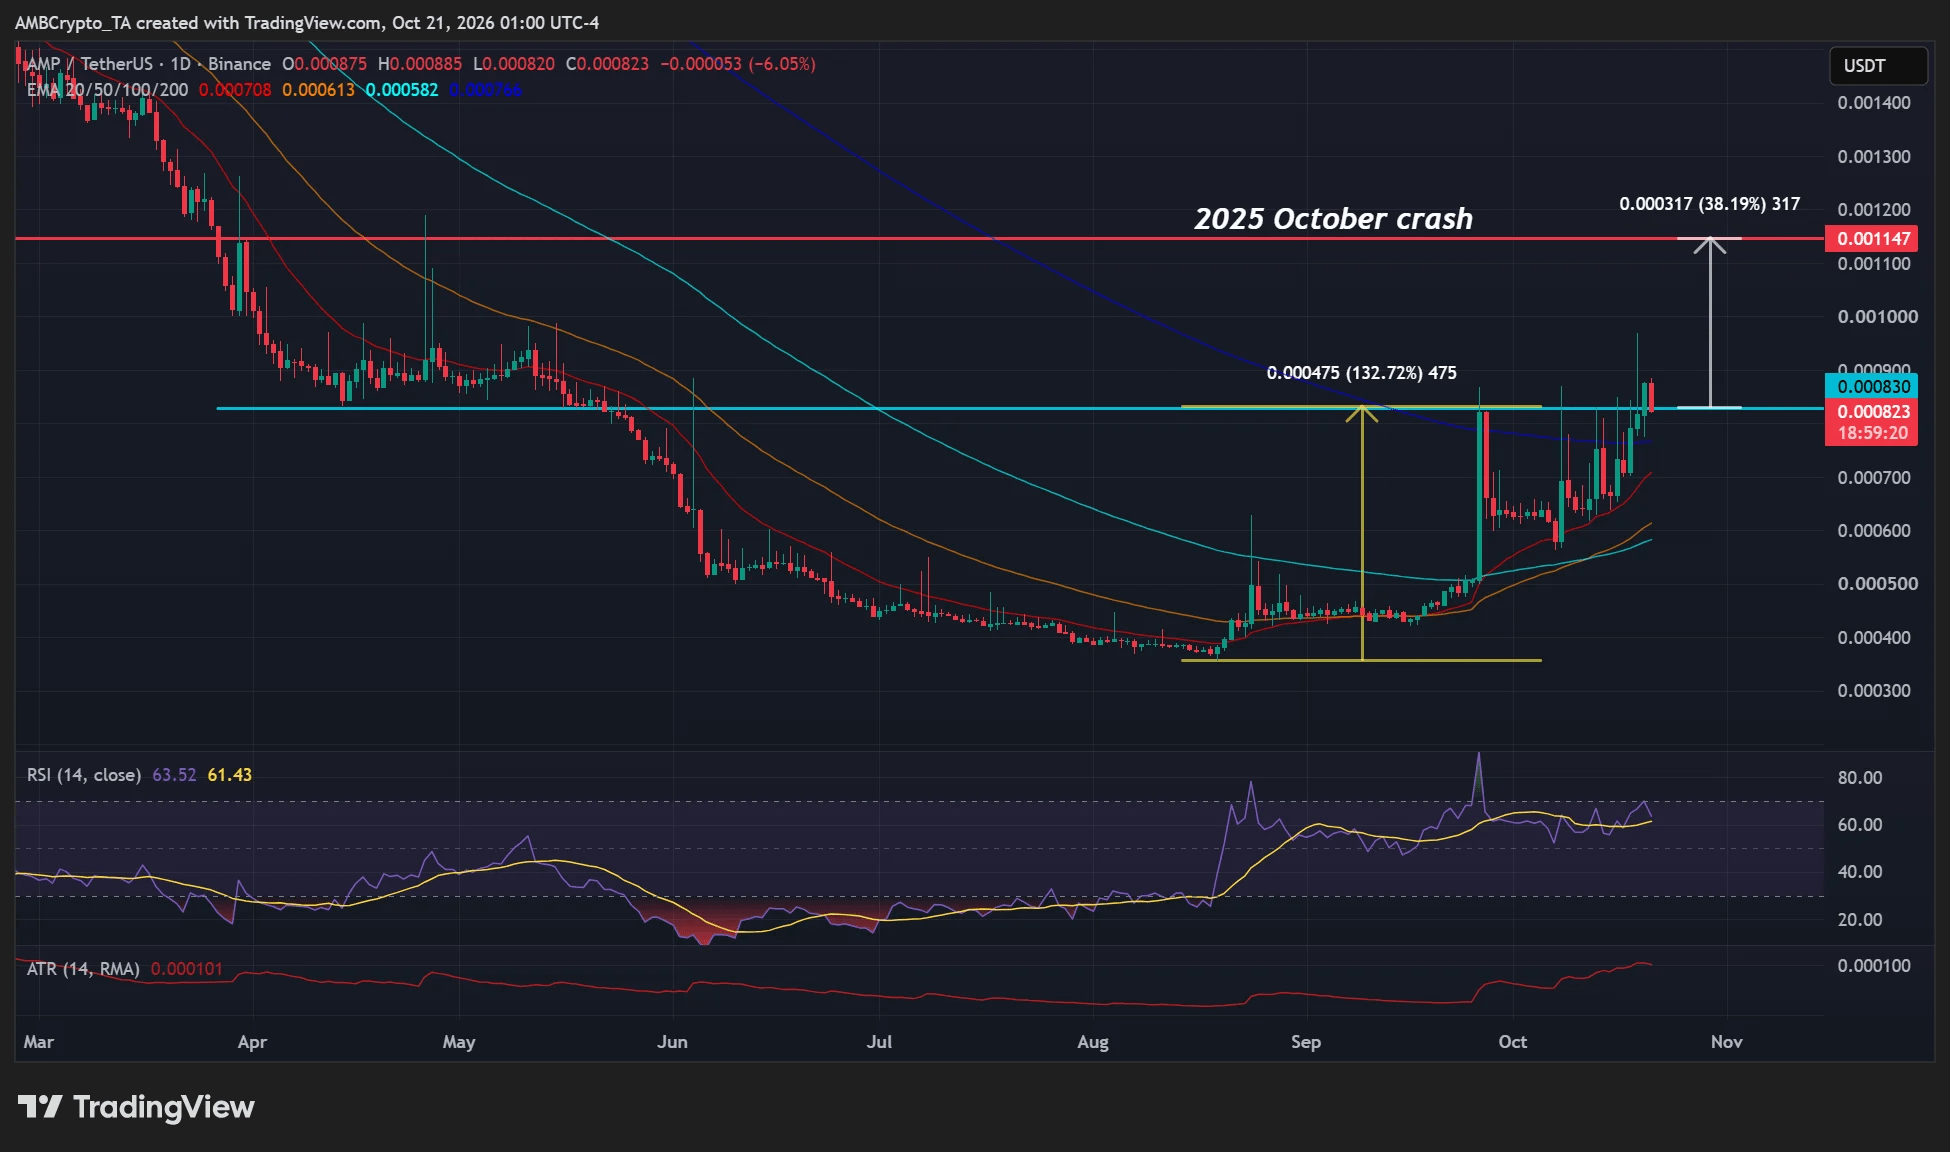
AMP reclaims the $0.000830 level, which served as support in April and early May.
Trading volume across the market fell by more than 60% in 24 hours, according to CoinGecko.
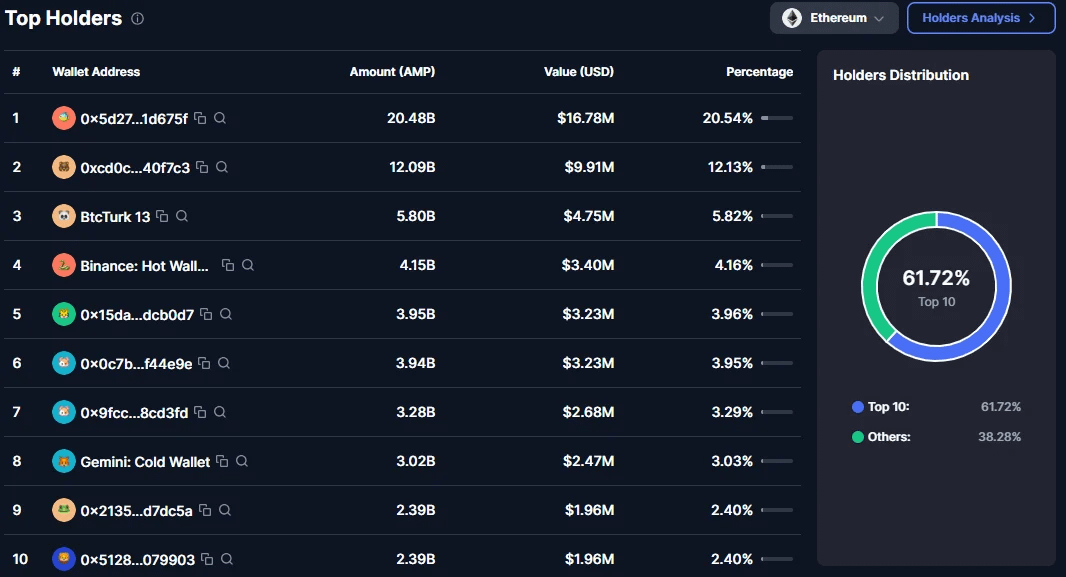
Around 62% of the supply is held by the 10 largest addresses, increasing the risk of price volatility.
Weakening trading volume could hinder AMP’s recovery
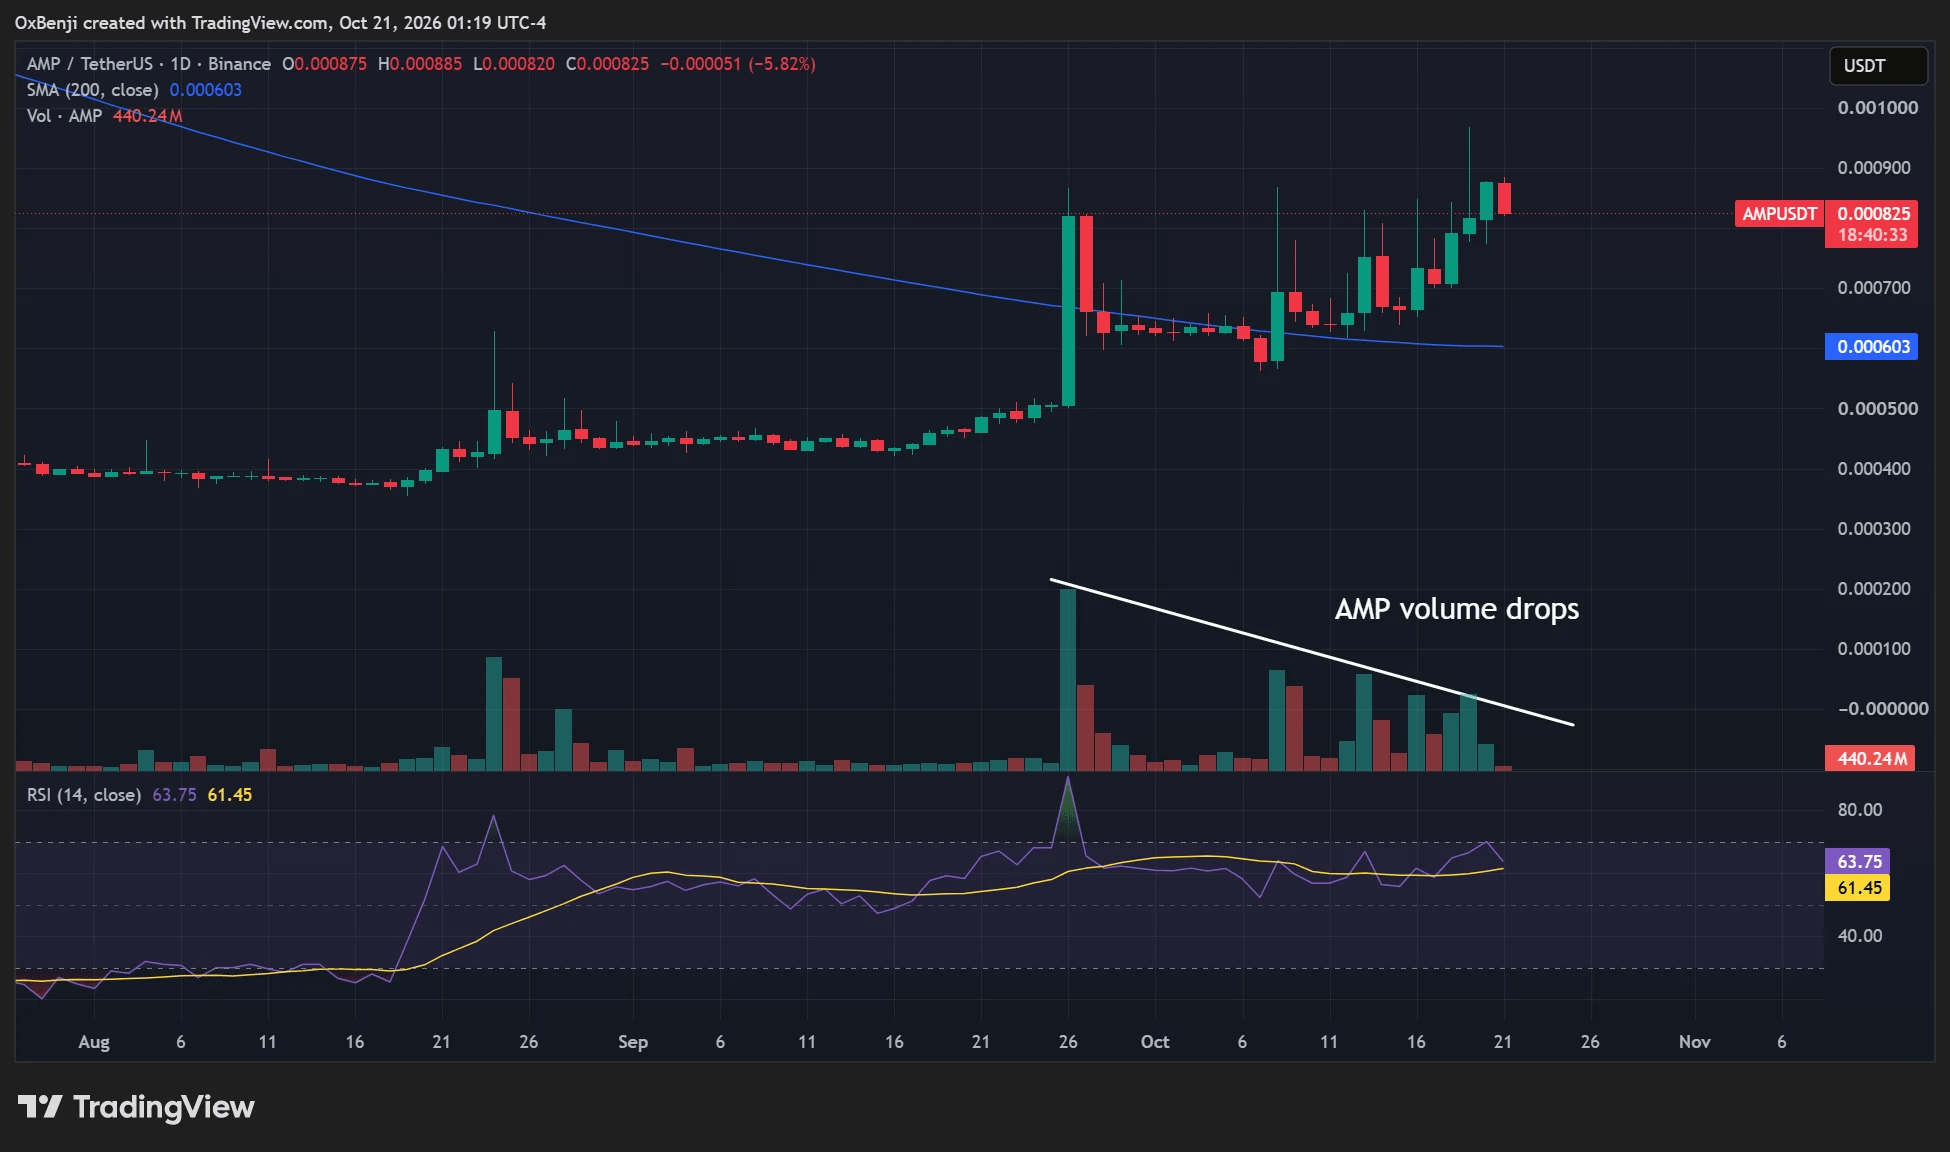
AMP’s trading volume has fallen sharply, even as its price has held on to most of its recovery since August. This decline could make it difficult for AMP to sustain the price range it has just reclaimed.
On Binance, trading volume denominated in AMP has fallen around sevenfold from its peak, to approximately 3 billion tokens at the time of reporting. CoinGecko also recorded a more than 60% drop in AMP’s total trading volume across the market over 24 hours.
AMP price, trading, and supply distribution metrics Metric Recorded level Reference point or range Price at the August low Around $0.0004 Starting point of the recovery Price after recovery Above $0.000830 Breaking above the former support zone from April and early May Gain from the August low More than 130% At the time of reporting Trading volume on Binance Around 3 billion AMP Down around sevenfold from its peak Change in total trading volume Down more than 60% Over 24 hours, according to CoinGecko Share of supply held by the 10 largest addresses Around 62% Concentration of AMP holdings
 Source: AMP/USDT, TradingView
What does the $0.000830 level mean for AMP’s price?
The $0.000830 level was an AMP support zone in April and early May, before it was broken in June. Closing back above this level opens the possibility of reclaiming April’s consolidation range.
AMP closed above $0.000830 for the first time since its recovery began in the second half of 2026. The support zone had previously been breached during a sharp sell-off across the cryptocurrency market in June.
AMP’s price has also moved above its moving averages, signaling a shift to a bullish trend for the first time since early 2025. The Relative Strength Index (RSI) favors buyers. The recovery has continued despite risk aversion in the market in early October.
 Source: AMP/USDT, TradingView
For AMP’s uptrend to continue, the price needs to hold above its moving averages, supported by strong trading volume. If volume continues to decline, AMP may fail to hold the April price range it has just reclaimed.
AMP supply is concentrated among the 10 largest addresses
Around 62% of AMP’s supply is held by the 10 largest addresses. This concentration could increase the risk of price manipulation, sharp volatility, and liquidations.
Concentrated holdings pose an additional risk alongside weakening trading volume. Positive price action and technical indicators are therefore not enough to rule out adverse volatility for AMP.
 Source: CoinMarketCap
Summary
AMP remains up more than 130% from its August low and has reclaimed an important price range. However, sharply lower trading volume and concentrated supply mean the recovery still lacks firm confirmation. The price’s ability to hold above its moving averages and trading volume trends are key factors to watch.
Source: https://tintucbitcoin.com/du-bao-gia-amp-ho-tro-co-tru-vung-khi-khoi-luong-giam-60/
Thank you for reading this article!
Like, comment, and follow TinTucBitcoin to stay up to date with the latest cryptocurrency market news and never miss any important updates!
$BTC $ETH $BNB $XRP $SOL