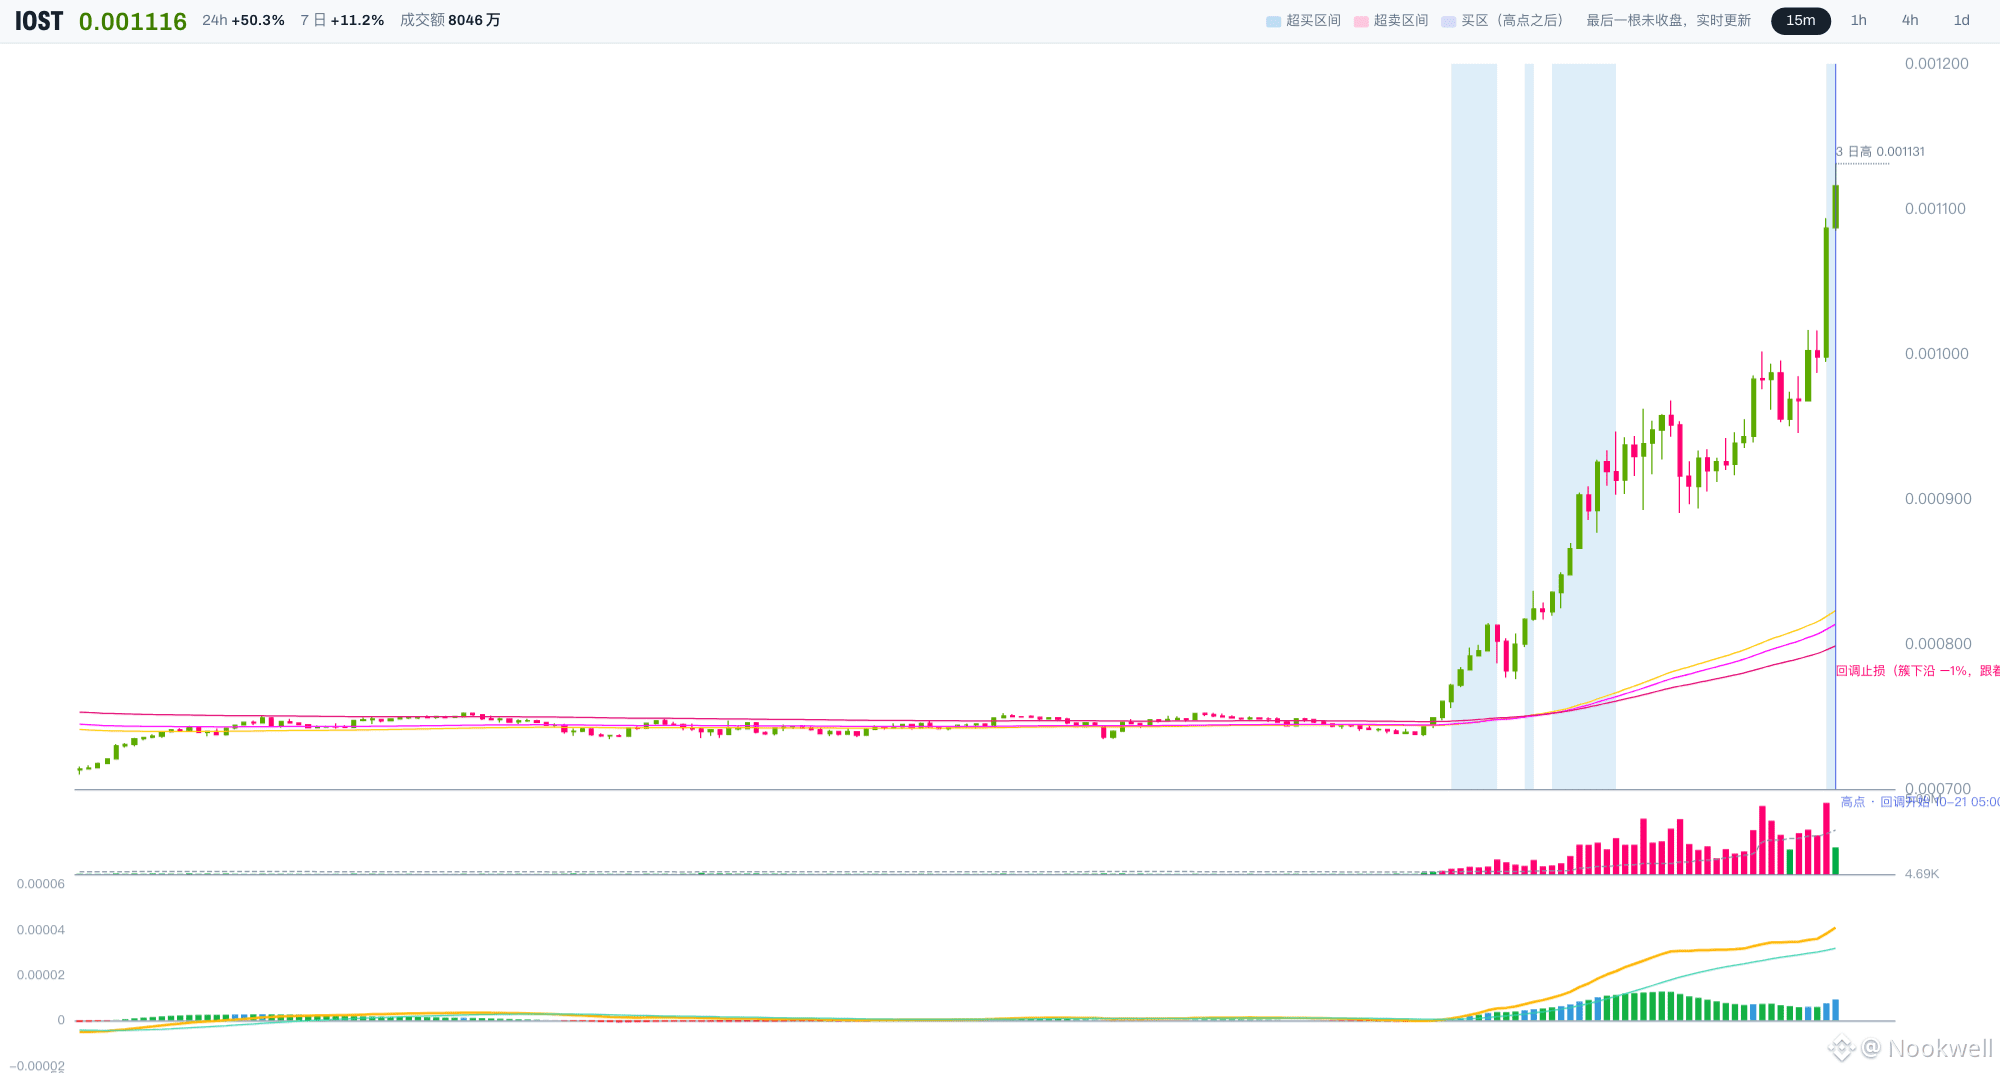
🔥 Volume surged 133x, and one big bullish candle slammed the price straight up to 0.001087—$IOST , is this a reversal?
Not so fast.
RSI 77, CCI 215, and the close is 32.69% above the top of the moving-average cluster.
This isn’t a breakout—it’s gone off the rails.
📌 1h: bearish moving-average alignment. 4h: averages tangled up. 1d: price still below the moving-average cluster.
Not one higher timeframe has turned around. Chase it here, and one wick could send it right back down.
So what if nearly all the conditions are flashing green?
This isn’t where I’m waiting to enter.
If price pulls back without breaking below the top of the moving-average cluster around 0.000819, and the 1h chart stabilizes, then we can talk about going long.
If it doesn’t pull back to that level, 0.001087 is a ceiling, not a floor.
⚠️ If the next 15m candle can’t close back above 0.001017, this volume spike is just the bears’ last gasp.
This candle is the line in the sand.
Are you bullish or bearish? Show your side in the comments.
#ETH #BTC $ETH $BTC