



Situation Analysis
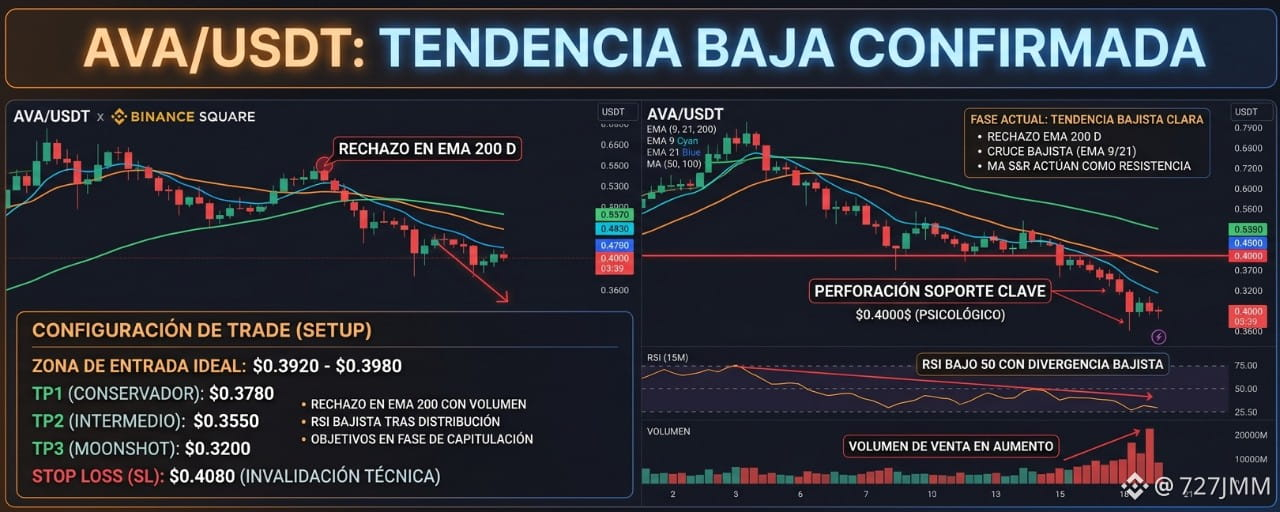
On the daily timeframe, AVA/USDT is trading around $0.3925, showing a loss of momentum below the psychological $0.4000 level. The 200 EMA is acting as an insurmountable resistance overhead, while the 50 MA and 100 MA are beginning to slope downward in alignment.
On the 15M and 5M charts, the 9 EMA crossed below the 21 EMA, forming a short-term bearish crossover (local Death Cross). The RSI on the 15M chart broke below the neutral zone, reaching 42 with bearish divergence, while selling volume is increasing, confirming liquidity outflows and validating the selling pressure in the current structure.
Trade Setup (Short)
Ideal Entry Zone: $0.3920 - $0.3980
TP1 (Conservative): $0.3780 (Take partial profits at direct support)
TP2 (Intermediate): $0.3550 (Next Fibonacci retracement level)
TP3 (Moonshot): $0.3200 (Extended target during the capitulation phase)
Stop Loss (SL): $0.4080 (Technical invalidation above the EMA 21)
Trade Range and Confluence
Why are we entering this position? We’re taking advantage of the strong rejection at the daily EMA 200, combined with the EMA 9/21 crossover on lower timeframes (5M/15M). The RSI falling below 50, along with rising selling volume, signals that the asset has finished its distribution phase and is officially entering a clear downtrend.