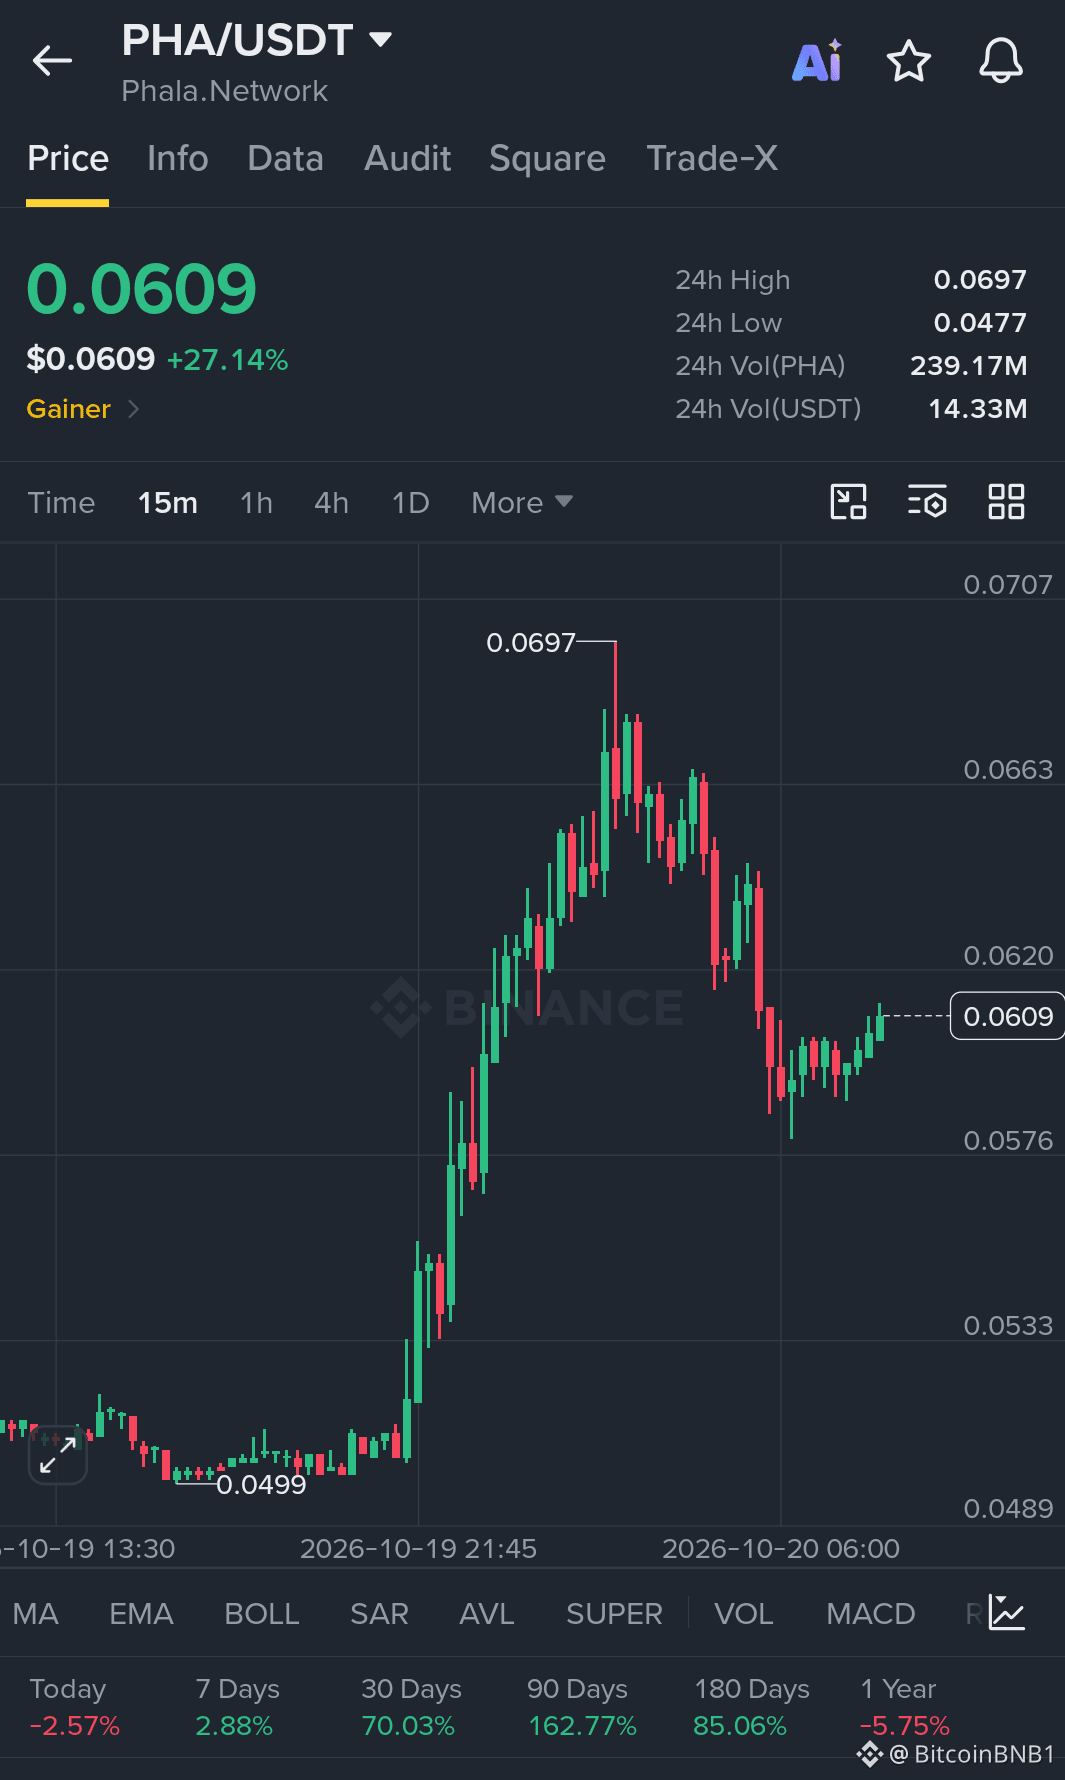
$PHA /USDT This Move Is Getting Interesting, But I’m Not Chasing the Pump.
Honestly, PHA has caught my attention after a strong move from around $0.0499 to a high of $0.0697. That is a serious rally in a short period, and the volume shows that traders are paying attention.
But here’s the part I’m watching closely: after hitting $0.0697, the price pulled back sharply and is now trading around $0.0609. Buyers are trying to recover, but the next move needs confirmation.
I wouldn’t blindly chase a green candle here. I’d rather watch how price reacts around support and whether buyers can reclaim the next resistance zone.
PHA/USDT Trading Setup
Current Price: $0.0609
Entry Zone: $0.0595–$0.0605
TP1: $0.0620
TP2: $0.0640
TP3: $0.0660
Stop Loss: $0.0582
Market View
PHA is showing short-term recovery after a sharp correction. The $0.0590–$0.0600 area is worth watching for potential support, while $0.0620 is the first hurdle buyers need to clear.
A convincing move above $0.0620 could open the door toward $0.0640 and $0.0660. However, if support breaks, the recovery could lose momentum quickly.
PRO TIPS
Don't enter just because the price is pumping.
Look for a confirmed bounce around the entry zone before considering a long.
Watch volume when price approaches $0.0620.
If price loses $0.0582, respect the stop loss instead of hoping for a reversal.
Keep position size sensible after such a volatile move.
My Take: PHA has momentum, but momentum alone isn't a trade signal. I want to see buyers defend support and push through resistance before getting too confident.
This is a technical setup based on the supplied 15-minute chart, not a guaranteed outcome or financial advice. Confirm the live price before entering, and remember that rapid volatility can invalidate these levels.
$PHA
#CFTCAdvancesVoluntaryRegCAMFramework #BankOfRussiaSaysSelfCustodyBanStartsJuly2027 #JapanFSAPublishesOnChainFinanceForumMinutes