



Bitcoin (BTC) has fallen into the correction zone outlined in the previous analysis and reached the target area, but its next move is still taking shape. Trading volume has declined, and momentum remains muted. Even so, the base case still leans bullish. The key question is whether this pause will once again help establish a major low.
A correction that leaves the uptrend intact
The bearish divergence that emerged near $87,000 was interpreted as a sign that price momentum was cooling from overbought territory. After a pullback to the $80,000 level and a cooldown in the RSI, Bitcoin is once again testing the moving average that had served as a key benchmark.
This price action is similar to a correction that occurred once in the past. Back then, too, the price found support near that moving average before continuing its uptrend. There is no guarantee that the pattern will repeat, but it is cited as one reason to maintain a medium-term bullish outlook.
So far, neither the daily nor the weekly chart has confirmed a decisive break below the key moving average. The critical zone is $80,000–$82,000. In particular, Bitcoin needs to clearly reclaim $82,000 for this price range to be considered a more solid support area.
Bitcoin daily chart
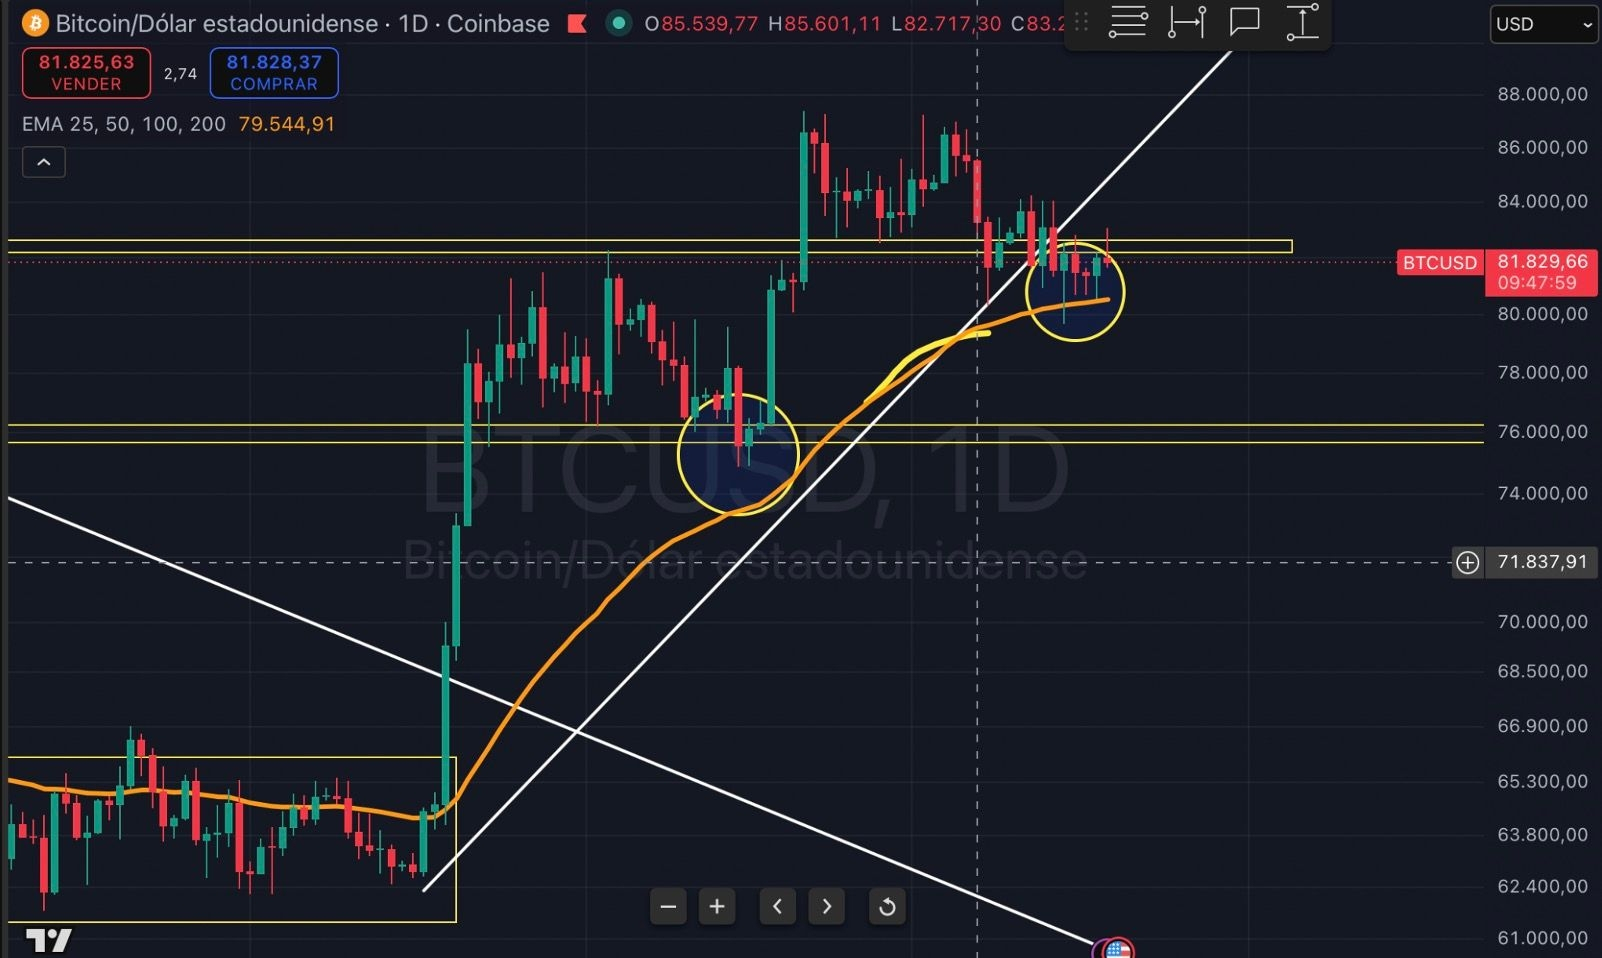
BTC/USD daily chart showing a retest of the moving average and the previous correction zone. Source: TradingView; chart by CryptoCedric.
Bitcoin weekly chart
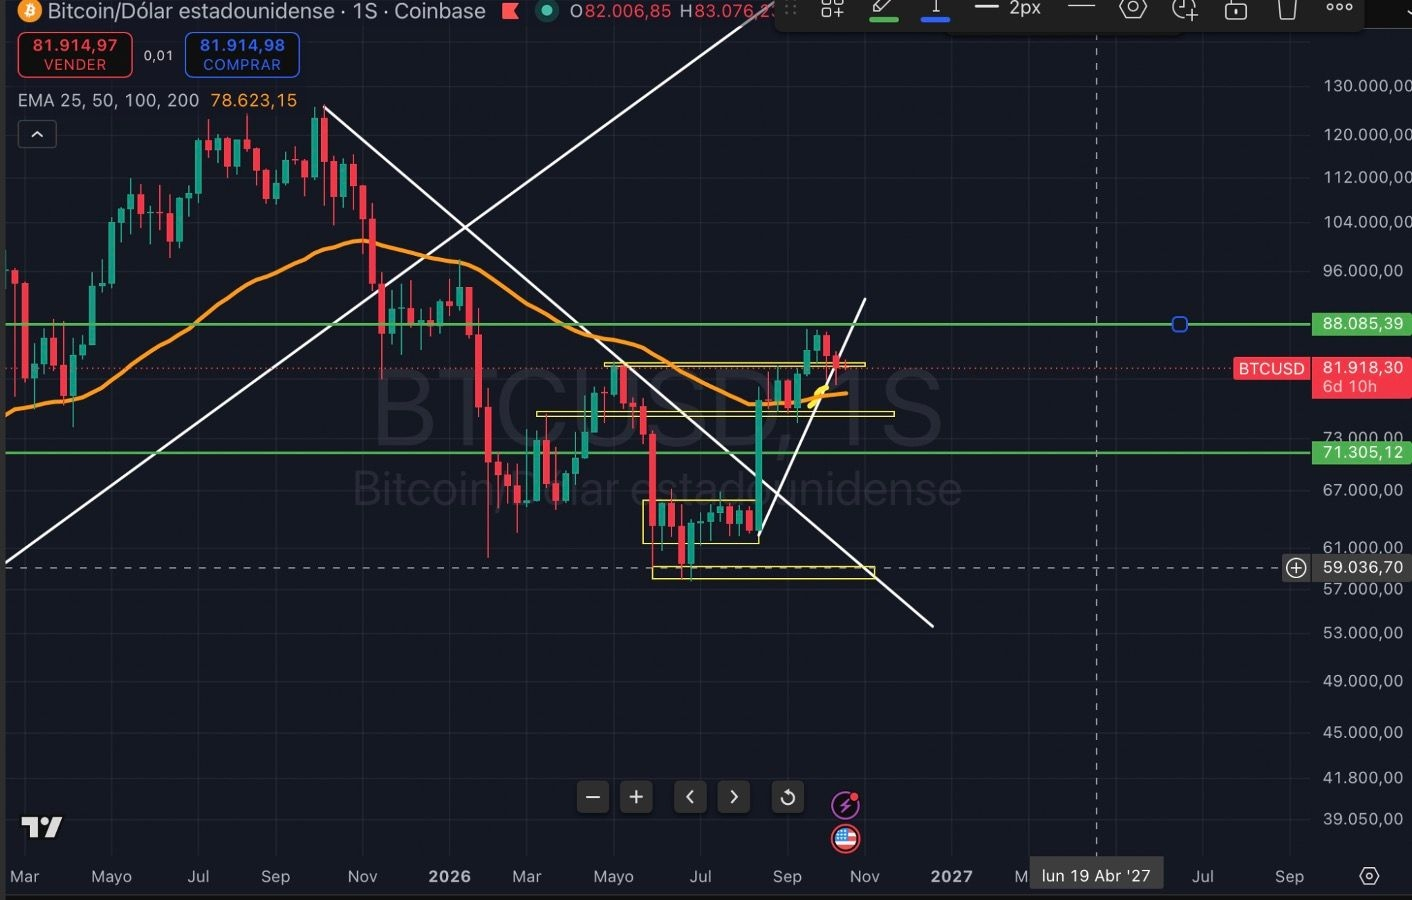
BTC/USD weekly chart showing key price levels and the key moving average. Source: TradingView; chart by CryptoCedric.
Also read: No iPhone Duo without pre-orders? Apple to reorganize store operations on October 23
ETFs still lack a sustained buying catalyst
Since the previous analysis, flows into spot Bitcoin ETFs have alternated between net inflows and outflows. According to the data, there was a net inflow of $175.7 million on October 13, but sentiment reversed sharply the next day, with a net outflow of $261.4 million. Flows were relatively modest over the following two days.
This suggests that institutional directional buying has yet to take firm hold. ETF flows and spot and derivatives market volumes are different indicators, but both point to the same thing: a decisive catalyst has yet to emerge.
Bitcoin ETF net flows
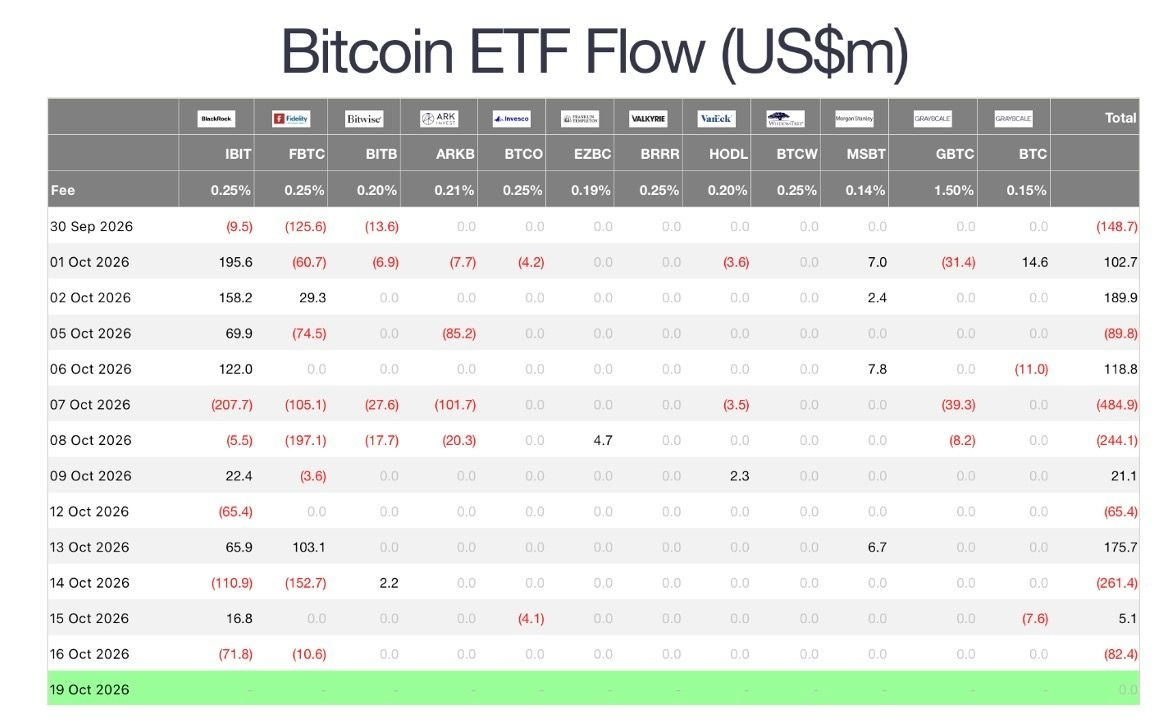
Daily net inflows and outflows for Bitcoin ETFs (in millions of dollars). Source: ETF flow table provided; based on the October 16, 2026 closing data.
What it will take to reach $94,000
The $94,000 forecast, previously presented as the final target for the bullish scenario, remains in place for now. Before that, however, Bitcoin needs to break through resistance at $85,000, retest $87,000, and reclaim the entire $86,000–$88,000 range.
The signal to watch for in this range is not simply a brief move above resistance followed by a reversal, but a period of sideways trading in which buyers absorb selling pressure, followed by a shift to support. The process of a former resistance level turning into stable support needs to be confirmed before it can be considered a reliable signal backing another leg higher.
As long as the current support zone holds, it is also possible to interpret the price action as the formation of a local bottom. Conversely, if both this support and the moving average under observation break down, the current bullish scenario will need to be reassessed.
Solana and Ethereum: Maintain a medium- to long-term outlook
Altcoins are also on the radar from a medium- to long-term perspective. An initial purchase of Solana (SOL) was made near $64, and the medium- to long-term strategy remains to consider adding more in the $100–$103 range.
A similar approach is being considered for Ethereum (ETH), with around $2,380 cited as a potential range for additional purchases.
Price action has quieted somewhat, but the baseline scenario remains unchanged. The market is now focused on defending support at $80,000–$82,000, reclaiming $82,000, and breaking above $85,000. Only if all three conditions are met can attention shift to $87,000 and the entire $86,000–$88,000 range. The battle between buyers and sellers in that zone is likely to serve as a test of whether Bitcoin can take another step toward $94,000.
Next read: Will AI’s “black box” be opened? Former OpenAI researcher says “90% of neurons perform a single function”