

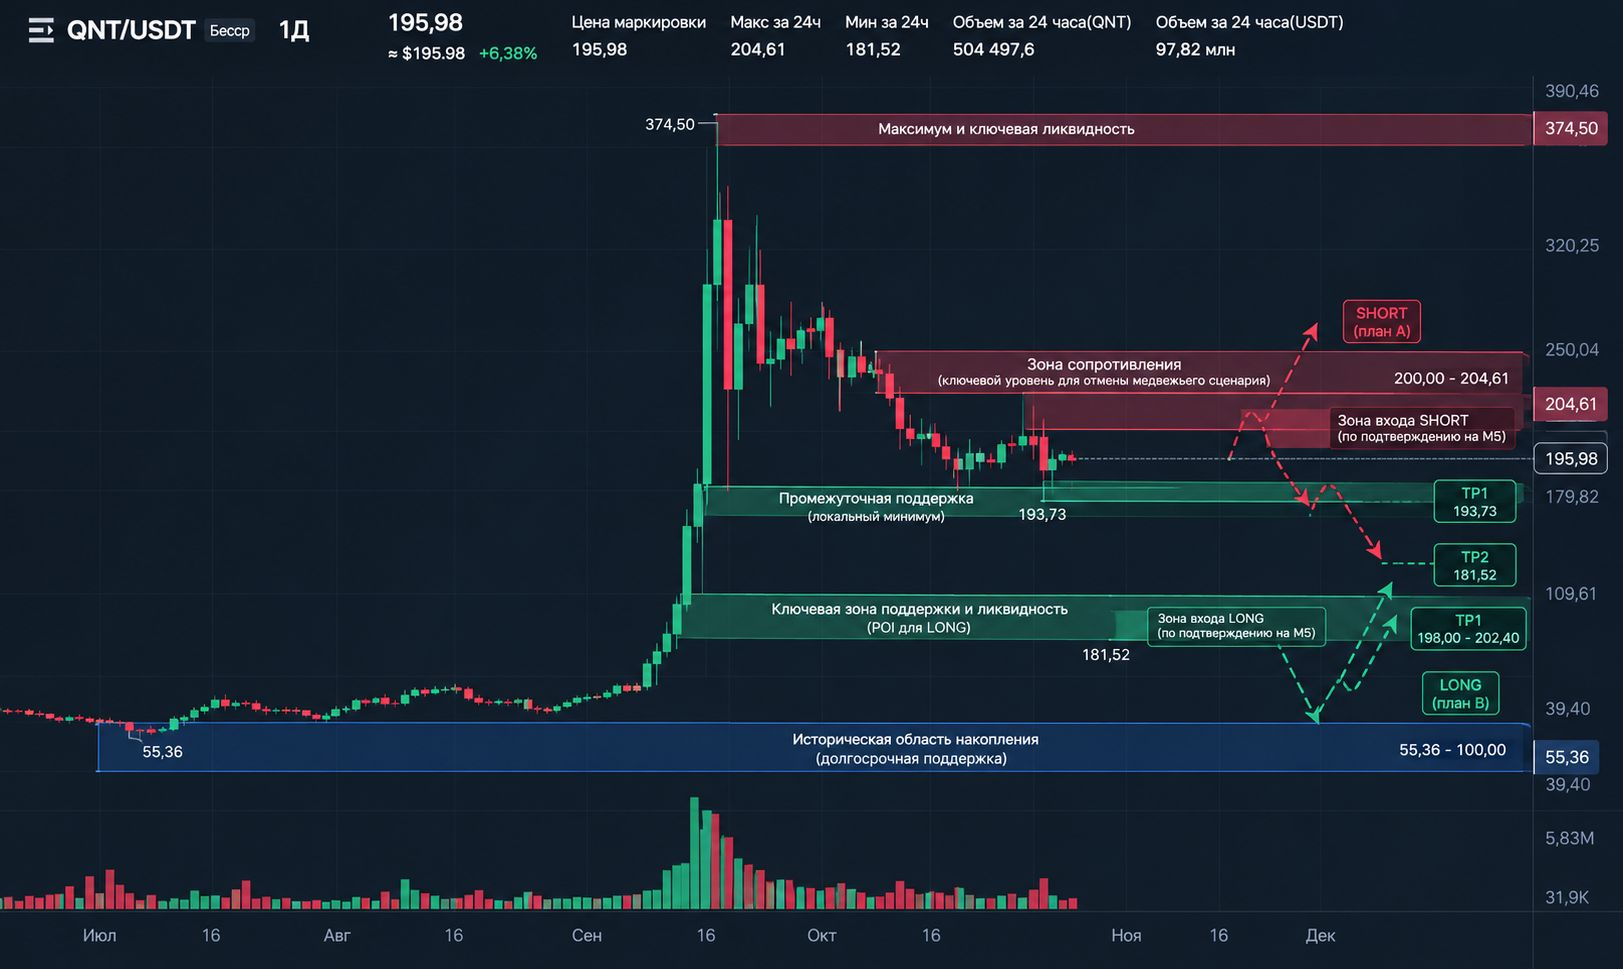
$QNT/USDT — WEEKLY TRADING PLAN: After the move to $374.50, the market is looking for the next liquidity
QNT rose from the $55–60 area to $374.50, but then lost a significant portion of its momentum. The key question now is whether the market will continue its corrective Delivery toward $181.52 or form a reversal after sweeping the lower liquidity?
At the time the screenshots were provided, price was around $195.98. Over the past 24 hours, the market reached a high of $204.61 and a low of $181.52. After recovering from the lower boundary, price failed to sustain the local upward impulse and returned to $196.
This is an important area on the chart. Buyers have already shown they can trigger a bounce, but they have not yet proved they can change the higher-timeframe structure.
My working hypothesis for the week is a bearish bias until $204.61 is reclaimed with structural confirmation. However, I do not view SHORT as an unconditional trade: the market must provide confirmation on a lower timeframe. If it does not, the right decision is WAIT.
1. Narrative A → B → C: What the Market Has Done and Where It May Go
A — From an Extreme Impulse to a Corrective Structure
On the higher-timeframe chart, QNT made a powerful upward move from the $55–60 area to a high of $374.50. A sharp correction began after the extreme was reached.
The subsequent price action shows a sequence of lower highs and lower lows. On H4, price fell from the $278 area to $181.52. It then bounced to $204.61, but this did not lead to a sustained recovery of the previous structure.
The latest part of the chart shows that price is back around $196.
Fact: Since reaching the $374.50 high, the market has been in a deep correction, and the H4 structure is predominantly bearish.
Interpretation: Buyers have not yet managed to turn the local recovery into a full directional reversal.
B — Next Expected Delivery
The primary scenario assumes the correction will continue, provided sellers retain control of the $200–204.61 area.
The nearest target is $193.73, the local M15 low. If the market breaks this level and confirms continuation of the bearish structure, $181.52 becomes the next area of focus.
But there is a fundamental difference between these levels and an actual entry. A decline to the target alone does not create a trade signal. We need to wait for price to reach the POI, sweep liquidity, form an MSS and an impulsive displacement, and retest the FVG/IFVG on M5.
If the market continues lower without a suitable retest, I will not chase price.
C — Invalidation: When the Bearish Hypothesis Weakens
The key boundary for the current scenario is $204.61.
If price recovers above this level, forms a bullish MSS, and continues to build an upward structure, the bearish bias will need to be reassessed.
This does not mean that any move above $204.61 automatically creates a LONG. We need to assess whether buyers have truly changed the structure and can hold price above the reclaimed level.
The Narrative remains a working hypothesis until the market confirms the next Delivery.
2. Timeframe Hierarchy: W1 → D1 → H4 → H1 → M15 → M5
W1 — Higher-Timeframe Context
The weekly chart shows an extreme price expansion followed by a retreat from the $374.50 high.
This move alone does not determine the future trend. After a vertical impulse, either a prolonged correction or the formation of a new base for growth is possible.
At this stage, there is not enough evidence to consider the higher-timeframe structure restored.
W1 conclusion: The market is in a repricing phase after an extreme impulse. Do not decide to go LONG solely because price has fallen significantly from its high.
D1 — Main Direction
After the upward impulse, a pronounced corrective move formed on the daily chart. Price fell from the $280 area to $181.52, then bounced to $204.61.
The subsequent return to $196 shows that the local recovery has not yet held.
For the daily picture to change, buyers need to reclaim key levels and demonstrate their ability to form higher highs and higher lows.
D1 conclusion: The corrective bearish scenario remains the priority. A sustained reversal upward has not yet been confirmed.
H4 — Structure, Range, and Liquidity
On H4, the sequence of lower highs is clearly visible. The last significant low is $181.52, and the high of the subsequent recovery is $204.61.
These boundaries allow us to define a local Dealing Range for the current plan.
As long as price remains inside the range, we need to assess its reaction at the boundaries. A brief move beyond a level without structural confirmation is not a sufficient signal.
H4 conclusion: Sellers retain the advantage until buyers reclaim and hold the $200–204.61 area.
H1 — Current Delivery
On H1, we can see a move from $181.52 to $204.61, followed by a pullback.
The latest candles show a decline from local highs and trading around $196. This supports the bearish hypothesis but does not guarantee further downside.
The key question is whether price will form a new lower high and continue lower, or move back above the local highs.
H1 conclusion: Local Delivery has weakened. The next directional impulse still needs to be confirmed.
M15 — Working Structure
On M15, price reacted from $181.52, recovered to the $198–202 area, and then declined again.
The local low at $193.73 is the nearest reference point for assessing structure. A break below it could open the way to a retest of $181.52, but only if the move is confirmed to continue.
If, instead, price sweeps liquidity below the local low and quickly moves back above it, there will be grounds to consider an alternative scenario.
M15 conclusion: The market is between local resistance and lower liquidity. The direction of the next impulse is not yet definitively established.
M5 — The Only Timeframe for Entry Confirmation
I will not predefine an Entry on M5. First, price must form the required sequence:
Liquidity Sweep — taking liquidity.
MSS — confirmed break of local structure.
Displacement — a directional impulsive move.
FVG/IFVG Retest — a return to the formed area to test the reaction.
Only after this sequence is complete is there a basis for assessing an entry, stop-loss, and risk-to-reward ratio.
POI is an area to watch. Entry is the result of confirmed price behavior. These terms are not interchangeable.
3. Key Levels and Dealing Range
For the current local plan, we use the $181.52–204.61 range.
The range is $23.09 wide, and its midpoint is approximately $193.07.
Level
Significance for Analysis
$204.61
Upper boundary of the local range and key invalidation level for the bearish hypothesis
$200.00–202.40
Nearest area where sellers may potentially react
$197.90–198.50
Local resistance area
$193.73
Intermediate M15 low
$193.07
EQ — midpoint of the local range
$181.52
Lower boundary of the range and key sell-side liquidity area
$277.94
Significant high in the broader H4 context
$374.50
Extreme of the preceding impulse
These levels carry different weight. $193.73 belongs to the local structure, $181.52 is a more significant corrective low, and $204.61 is the boundary whose reclaim would call the current bearish scenario into question.
Premium / Discount
Within the $181.52–204.61 range:
EQ: around $193.07.
Discount: below $193.07.
Premium: above $193.07.
At around $195.98, the market is slightly above EQ, in the local Premium zone. This allows us to look for SHORT conditions if price returns to a suitable POI.
However, Premium alone is not a signal. Price could continue rising, and the local range could change.
In the broader H4 range of $181.52–277.94, by contrast, price is in Discount. Therefore, we cannot automatically apply the local Premium logic to the entire higher-timeframe range.
Practical takeaway: Price location helps identify an area to look for a trade, but it does not replace confirmation on M5.
4. Liquidity: What Has Been Swept and Where the Next Target Lies
Moves Observed So Far
The first significant episode was an impulse to $374.50 followed by a sharp reversal. Price failed to hold the extreme, after which a deep correction began.
The market then formed a low at $181.52 and recovered to $204.61. After that, the recovery weakened.
It is important not to attribute unconfirmed events to the chart: the available screenshots let us identify price extremes and subsequent reactions, but do not provide sufficient grounds to claim that every specific liquidity zone has already been fully swept.
Where to Look for Liquidity Now
Buy-side liquidity:
local highs around $198–202;
the upper boundary of the range at $204.61.
Sell-side liquidity:
the local low at $193.73;
the corrective low at $181.52.
Expected Delivery
Primary path:
$196 → $193.73 → $181.52.
This is a hypothesis, not a prediction with a guaranteed outcome.
To confirm continued downside, the market must show acceptance below the local low and a bearish structure. If, instead, lower liquidity is swept and price quickly recovers with a bullish MSS, priority may shift to Plan B.
5. POI: Where to Watch, Not Enter Automatically
POI A — $200.00–204.61
This is the main area to watch for a potential SHORT.
Price may encounter sellers again here. We need to assess the reaction around local liquidity, candle structure, and the presence of bearish momentum.
Conditions for further consideration of a SHORT:
price reaches the area of interest;
local highs are swept, or another confirmed liquidity grab occurs;
a bearish MSS forms on M5;
downward Displacement appears;
price returns to the FVG/IFVG formed by this move.
If the sequence is not complete, there is no trade.
POI B — $193.73–181.52
This is an area to watch for a potential buyer reaction.
If price falls to the lower boundary, we need to check whether sell-side liquidity is swept and whether the structure recovers.
A LONG requires:
a sweep of the lows;
a bullish MSS;
upward Displacement;
an FVG/IFVG retest;
confirmation on M5.
A simple touch of support is not enough.
The principle remains unchanged: POI ≠ Entry.
6. Plan A — Continued Correction and SHORT
The primary scenario assumes that the $200–204.61 area will continue to act as resistance and that price will head toward lower liquidity.
Expected Delivery: $196 → $193.73 → $181.52.
Conditions for the Scenario
Price returns to the POI.
It sweeps local buy-side liquidity.
It forms a bearish MSS on M5.
It shows downward Displacement.
It returns to the FVG/IFVG.
It confirms continuation of the move after the retest.
FTA and TA
FTA — $193.73. Price reaction should be assessed at this level, as it is the nearest local low.
TA — $181.52. This target is considered if a confirmed break below $193.73 occurs and the bearish structure holds.
If price reaches the FTA and shows a strong buyer reaction, continuing to hold the position without reassessing risk is not justified.
Entry, SL, and RR
The screenshots provided do not show a confirmed M5 trigger, so no specific Entry or SL is being set at this time.
After a signal forms:
Entry is determined by a confirmed FVG/IFVG retest.
SL is placed beyond the Sweep extreme, taking structure and volatility into account.
TP is determined by the actual Delivery targets.
RR is calculated only after Entry and SL have been determined.
Setting exact values in advance would create false precision.
7. Plan B — Sweep of Lower Liquidity and LONG
The alternative scenario becomes relevant if sellers push price toward $193.73 or $181.52 but fail to establish acceptance below.
In that case, the following sequence may occur:
SSL Sweep → bullish MSS → Displacement → FVG/IFVG Retest → LONG.
Potential Targets
Depending on where the confirmed entry occurs:
$193.73 — reclaim through the local level;
$198.00–202.40 — nearest resistance area;
$204.61 — upper boundary of the local range.
These targets should not be treated as a mandatory sequence. If buyers cannot hold the structure, the scenario must be reassessed.
When Plan B Is No Longer Relevant
If price simply bounces off support without a Sweep and MSS, there is no confirmation for a LONG.
If the market breaks below $181.52 and continues to form a bearish structure, trying to buy just because the price is low does not meet this plan's conditions.
8. Invalidation and Risk Management
The bearish hypothesis loses strength if price makes a sustained recovery above $204.61 with confirmed bullish structure.
However, scenario invalidation and the stop-loss for a specific trade are different things. The stop is determined by the M5 entry structure, not by an arbitrarily chosen distance from price.
Before a signal appears:
do not set an Entry;
do not invent an SL or RR;
do not open a position based only on the anticipated direction;
do not increase risk to compensate for a missed move.
For this plan, the risk guideline is no more than 0.5% of capital per trade. Position size is calculated after the stop and the distance to it have been determined.
9. Final Verdict for the Week
Bias: bearish until price reclaims $204.61 with structural confirmation.
Primary hypothesis: the correction continues toward $193.73 and potentially $181.52.
Alternative: lower liquidity is swept, followed by a bullish MSS and recovery toward $198–204.61.
Key POIs: $200.00–204.61 to watch for a potential SHORT; $193.73–181.52 to watch for a potential reversal.
Current status: WAIT. The charts provided do not offer sufficient confirmation to set a specific Entry, SL, and RR.
QNT has already covered significant ground since its extreme impulse. So the priority now is not to guess the next candle, but to determine which side is actually controlling Delivery.
If sellers maintain the structure, the market may continue toward lower liquidity. If buyers sweep sell-side liquidity and confirm a reversal on M5, the bias will change.
Do not chase price. Wait for the market to show intent and confirmation, and only then look for an entry point.
Which scenario do you think is more likely for QNT this week — continued Delivery toward $181.52 or a reversal after an SSL sweep? Share your hypothesis and the level that would confirm it on M5.