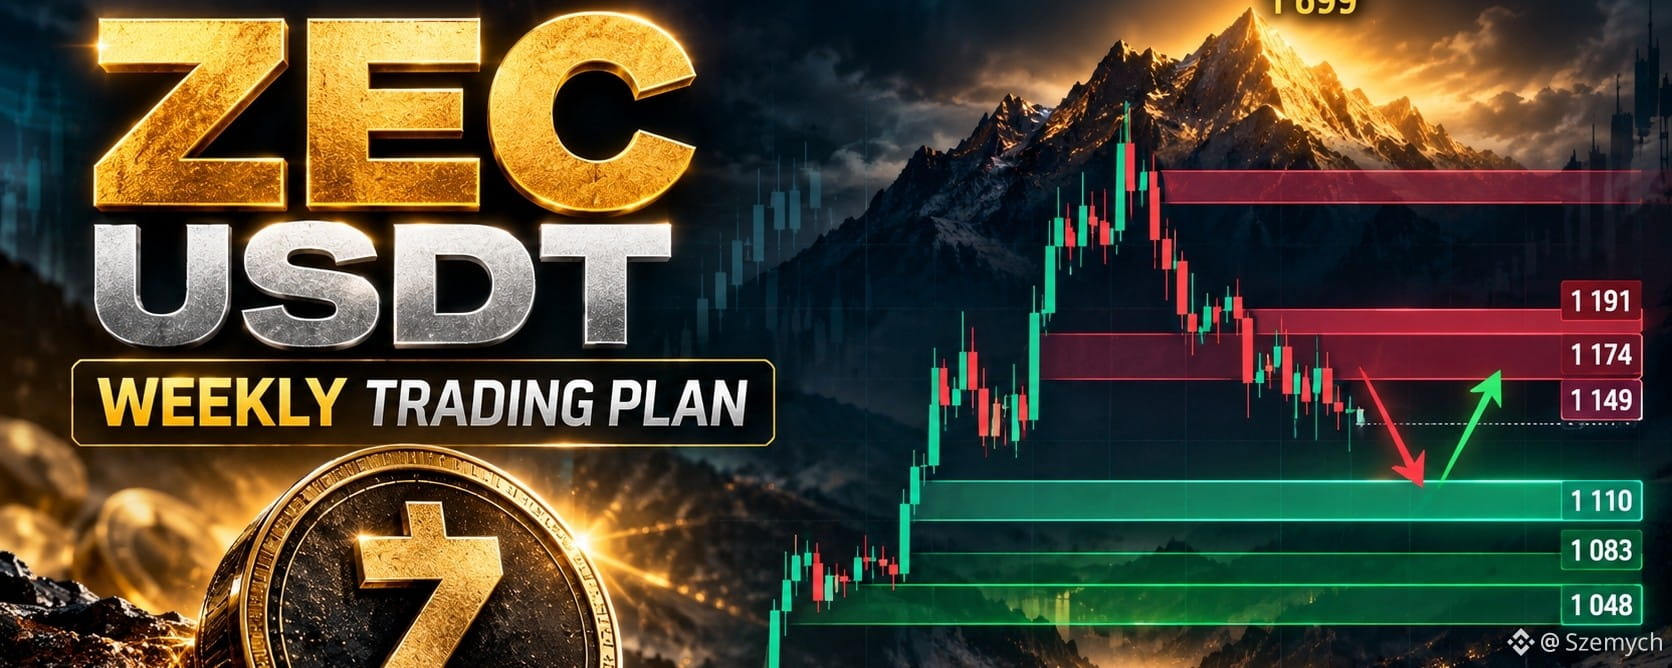

#zec $ZEC/USDT — WEEKLY TRADING PLAN: After rising to $1,699, the market is looking for a new direction
ZEC rose to $1,699, but was unable to hold those highs. Now the key question is whether the correction toward lower liquidity will continue or buyers will manage to seize the initiative.
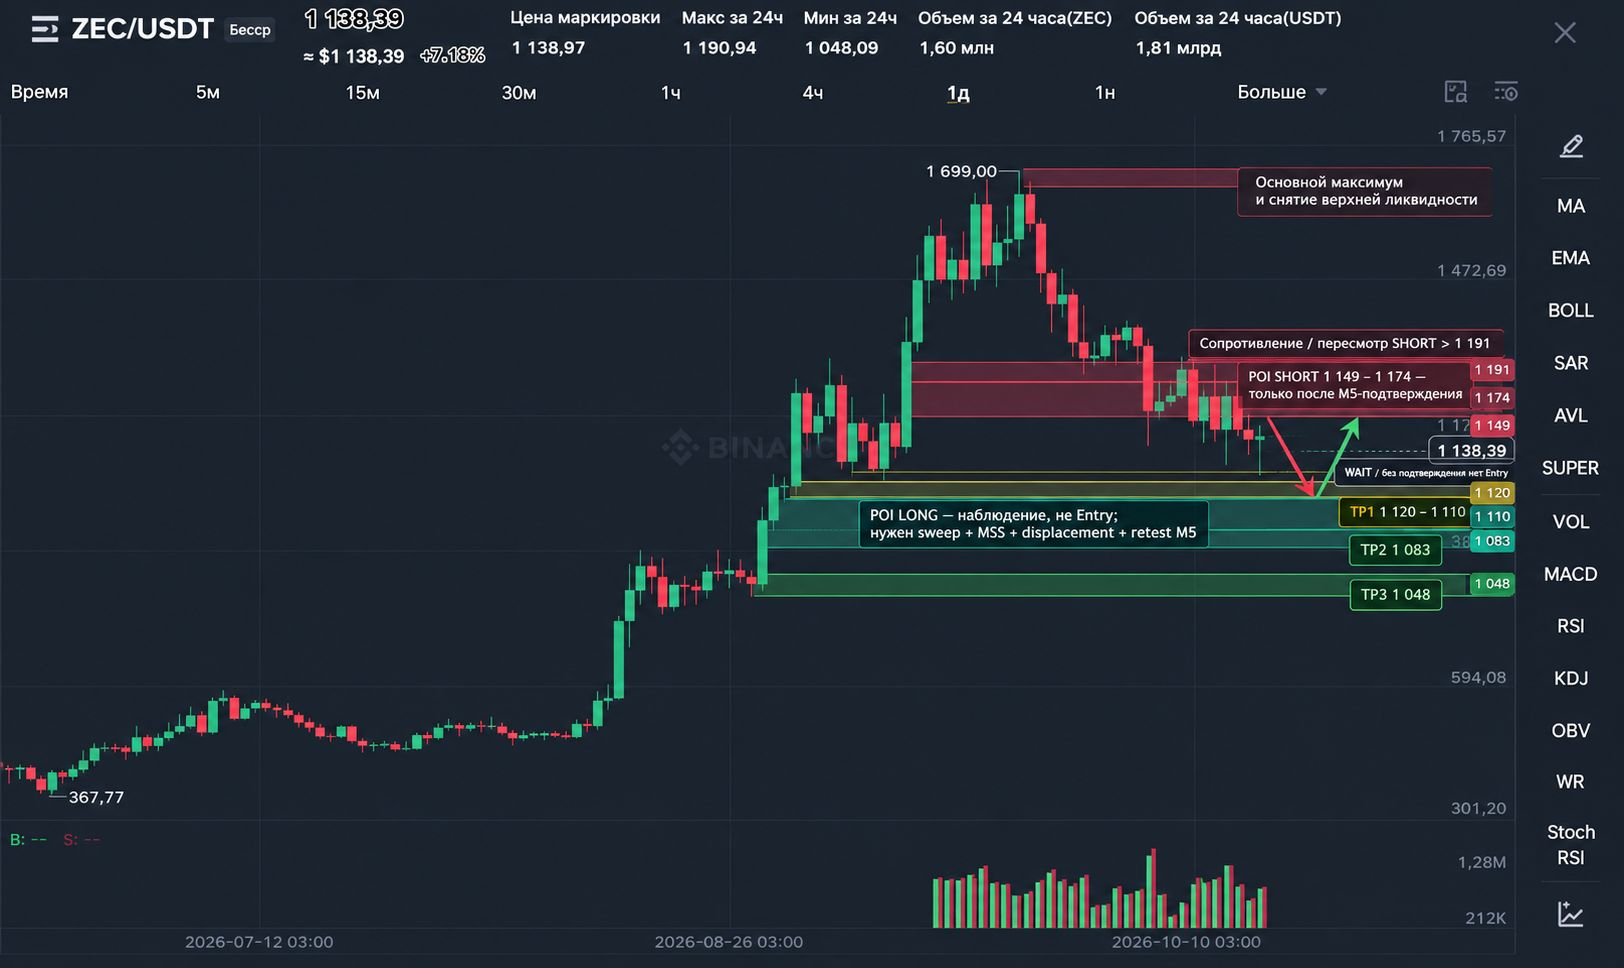
At the time of the charts provided, ZEC/USDT is trading around $1,139. After a powerful upward impulse, the market turned lower, and recent recovery attempts have yet to bring the price back to key resistance levels.
My working hypothesis for the week: as long as ZEC trades below the $1,174–1,191 area, the corrective scenario remains the priority. However, this does not mean we should open a SHORT immediately. We need to wait for price to move into the area of interest, sweep liquidity, and confirm the structure on M5.
Let's examine where the current Delivery came from, which levels will determine the next move, and under what conditions the scenario could change.
1. W1 — Global Context: A Strong Impulse Does Not Yet Guarantee Further Upside
On the higher timeframe, ZEC made a powerful upward move, after which price reached a high of around $1,699.
This rally significantly changed the scale of the move, but after reaching the peak, buyers failed to hold price near the highs. A correction began, bringing the market to the $1,100–1,140 area.
It is important to distinguish between two concepts here:
Global context: the market has made a substantial move upward.
Current Delivery: after the high, price is moving lower and forming a local downtrend structure.
Therefore, the strong preceding rally alone is not a reason to buy. Likewise, the correction does not prove that the broader uptrend has definitively ended.
To do this, we need to watch the price reaction at key levels and whether the market can form a new, confirmed structure.
2. D1 — Sellers Retain the Initiative, but Where Is the Target?
After reaching a high of $1,699, price declined steadily. Attempts to recover did not bring it back to the previous highs, and the latest moves show selling pressure.
Three areas stand out on the daily chart:
$1,174–1,191 — the nearest significant resistance; a move back above it would weaken the current bearish scenario.
$1,110–1,083 — an area where lower liquidity may be tested.
$1,048 — the last prominent low, from which the market made a notable bounce.
The main task is to determine where the next Delivery will head.
If price continues to form lower highs and sellers maintain control of the $1,149–1,174 area, another move toward lower liquidity would be a logical scenario.
But if price moves back above resistance and starts forming an upward structure, continuing with a SHORT without reassessing the situation would no longer be justified.
3. H4 — The Key Decision-Making Area
On the four-hour chart, price declined after reaching a high of $1,699. The market then attempted to recover but failed to sustain the move toward $1,200 and above.
The low at $1,048.09 stands out. Price bounced from there, but the subsequent rise to $1,173.94 did not lead to sustained further upside.
This shows that buyers can trigger local impulses, but so far they have not been able to change the current structure.
Working Bias: corrective-bearish below $1,174–1,191.
One green candle or a brief wick through resistance is not enough to change this view. We need to see a sustained recovery, a change in structure, and confirmation of continuation on lower timeframes.
4. Narrative A → B → C: The Logic of Price Movement
A — Where the Current Delivery Came From
After rising to $1,699, the market turned downward. Upper liquidity above previous highs was taken during the upward move, after which price entered a corrective phase.
On the subsequent sections of the chart, price declines and buyers fail to return it to the previous highs.
Thus, the current Delivery is moving from the upper area of the market toward lower price levels.
However, we cannot claim that every decline is caused solely by liquidity being taken: this interpretation requires a detailed analysis of specific swings and price reactions.
B — Where the Next Delivery May Head
The primary scenario anticipates a move toward the $1,120–1,110 area.
If sellers break through this area and price holds below it, the next reference levels will be $1,083 and $1,048.
This is a sequence of potential targets, not a promise that each level will be reached. At every stage, we need to assess the price reaction, the magnitude of the move, and the structure.
Another possibility is a sweep of lower liquidity followed by a quick move back above the broken level. In that case, the market may set up a reversal pattern and an upward Delivery toward $1,149–1,174.
C — Invalidation: When the Primary Scenario Needs to Be Reassessed
A strong recovery above $1,191, with price holding that level and forming a bullish structure on H4, would weaken the bearish hypothesis.
In that case, the next recovery reference levels will be $1,220–1,254.
Important: Invalidation is not simply a touch of a level. We need to assess candle closes, structure, and price's ability to hold above resistance.
5. Key Levels and Liquidity Map
Level
Purpose
$1,254
Upper recovery reference level
$1,191–1,174
Key resistance and potential upper liquidity
$1,167–1,149
Local supply area and potential POI for a SHORT
$1,140
Current price area in the screenshots
$1,120–1,110
Nearest lower liquidity area
$1,083
Next reference level if the decline continues
$1,048
Key local low and lower liquidity
These levels should be viewed as a decision-making map, not a set of automatic signals.
What to Watch
Above: the price reaction around $1,149–1,174, followed by $1,191. If the market rises into this area and sweeps local highs, it is important to assess whether buyers can hold the level they reach or whether a bearish MSS follows.
Below: price action around $1,120–1,110. A sweep of the low followed by a quick recovery could set the stage for a reversal pattern. A sustained break with a retest from below, on the other hand, would increase the likelihood of the downward Delivery continuing.
6. Dealing Range: Where Are Premium and Discount?
For our working assessment, we will use the $1,048–1,254 range.
Its midpoint, Equilibrium, is around $1,151.
Premium: $1,151–1,254.
Discount: $1,048–1,151.
At the current price of around $1,139, the market is in Discount within the selected range.
But being in Discount does not mean price has to rise. It only describes price's position within the range. If the structure remains bearish, the market may continue lower and seek liquidity below.
Therefore, buying solely because price is in Discount does not fit our model. For a LONG, we need to wait for an SSL sweep and confirmation of a bullish structure on M5.
Likewise, price being in Premium is not an automatic signal to enter a SHORT: we need to see a seller reaction and confirmation of the structure.
7. POI #1 — Supply Zone at $1,149–1,174
This is the first area to watch if price potentially recovers.
The market may encounter supply here after a local bounce. A higher resistance zone is located around $1,174–1,191.
What We Need for a SHORT:
Price moves into the POI.
A local BSL sweep occurs.
A bearish MSS forms on M5.
An impulsive Displacement appears.
An FVG/IFVG forms, after which price returns to retest it.
Only after this sequence is complete is there a basis for considering an Entry.
If price simply reaches $1,160 and starts declining, that is not enough. Without confirmed structure, the trade remains a hypothesis.
Potential targets for a confirmed SHORT: $1,120–1,110, followed by $1,083 and $1,048.
8. POI #2 — Lower Area at $1,110–1,083
This area is worth watching for a potential buyer reaction after lower liquidity is swept.
However, we need to account for two fundamentally different scenarios.
Reversal scenario: price sweeps SSL, returns above a local level, forms a bullish MSS and Displacement, and then retests the FVG/IFVG. Only with this sequence in place should we consider a LONG.
Continuation scenario: price breaks through the $1,110–1,083 area, fails to return above it, and forms a bearish structure. In that case, the priority shifts to a retest of $1,048.
Remember that $1,048 is a significant reference level, not a guaranteed reversal point. A break of the low could open the way to further downside, so buying in advance just because price is near it is risky.
9. H1 → M15 → M5: What the Lower-Timeframe Structure Shows
H1
Price fell from $1,190.94. Subsequent recoveries failed to bring the market back to the high, so the short-term structure remains under selling pressure.
M15
After the low at $1,048.09, price bounced to $1,173.94. The market then began declining again.
This indicates that the recovery has not yet led to a sustained change in structure. Local bounces remain possible, though.
M5
In the most recent section shown, price bounced from $1,110.06, rose into the $1,149 area, and then pulled back to $1,139.
This is a local reaction, but not a confirmed trading setup. The screenshot does not allow us to reliably confirm the complete Liquidity Sweep → MSS → Displacement → FVG/IFVG Retest sequence for a specific trade.
Therefore, the right decision now is to observe, not to try to guess the next move.
10. Main Scenario for the Week — SHORT After Confirmation
Hypothesis: sellers will retain the initiative while price remains below $1,174–1,191.
Action Plan:
Wait for price to move into the $1,149–1,174 POI.
Check for a local BSL sweep.
Wait for a bearish MSS and Displacement on M5.
Consider an Entry only after an FVG/IFVG retest.
Monitor the targets at $1,120–1,110, $1,083, and $1,048.
The Stop Loss should be placed beyond the structural extreme formed during the sweep, taking volatility and trade structure into account.
The exact Entry and SL are not fixed in advance: they depend on actual confirmation. Therefore, calculating RR before a setup appears is not appropriate.
If price moves lower without a retest or without an opportunity for an acceptable risk-to-reward ratio, skip the trade. Do not chase price.
11. Plan B — LONG After a Sweep of Lower Liquidity
The alternative scenario assumes price first sweeps SSL in the $1,110 area or below, then quickly returns to the range.
Conditions for Considering a LONG:
A sweep of lower liquidity.
Price returns above a local level.
A bullish MSS on M5.
Displacement and formation of an FVG/IFVG.
A retest of the zone with confirmation of further upside.
If these conditions are met, the nearest reference levels could be $1,149–1,174.
If price recovers above $1,174–1,191 and holds this area, the likelihood of a deeper recovery will increase. But without confirmation, this outcome cannot be considered the base scenario.
12. Risk Management: No Trades Without Structure
At this stage, the charts provided do not justify precise Entry, SL, or RR levels.
The reason is simple: a POI defines an area to watch, not an entry point.
Until a confirmed setup forms, it is not possible to reliably determine a structural stop or assess the actual risk-to-reward ratio. Assigning these parameters in advance would create false precision.
When a setup appears, you need to:
determine the Entry on an FVG/IFVG retest;
place the SL beyond the structural extreme;
choose the TP based on the next liquidity areas;
calculate RR before opening a position;
skip the trade if the potential profit does not compensate for the risk.
Conclusion
ZEC is in a corrective phase after a strong upward move to $1,699. Until price recovers above $1,174–1,191 and forms a confirmed bullish structure, the priority remains with the scenario of a continued correction.
The main area to watch above is $1,149–1,174. The main area of interest below is $1,110–1,083, with $1,048 as an additional reference level.
But the key decision right now is WAIT. We do not sell just because the market is declining, and we do not buy just because price is in Discount.
First, liquidity must appear, followed by confirmation of structure, an impulse, and a retest. Only then is there a trading opportunity.
Which scenario do you think is more likely for ZEC this week: an SSL sweep below $1,110 followed by a move toward $1,048, or a recovery toward $1,174–1,191? Share your scenario and the level that would invalidate it in the comments.