


Six days after flagging signs of an October base in Bitcoin — low exchange reserves, whale accumulation and improving demand — the updated CryptoQuant picture shows those supports intact but the recovery uneven. Of three conditions required for a durable base, two are currently unmet. Spot demand approached zero and turned negative again, and accumulation is narrowing to the smallest whale cohort rather than spreading.
Spot Demand Failed Its Test
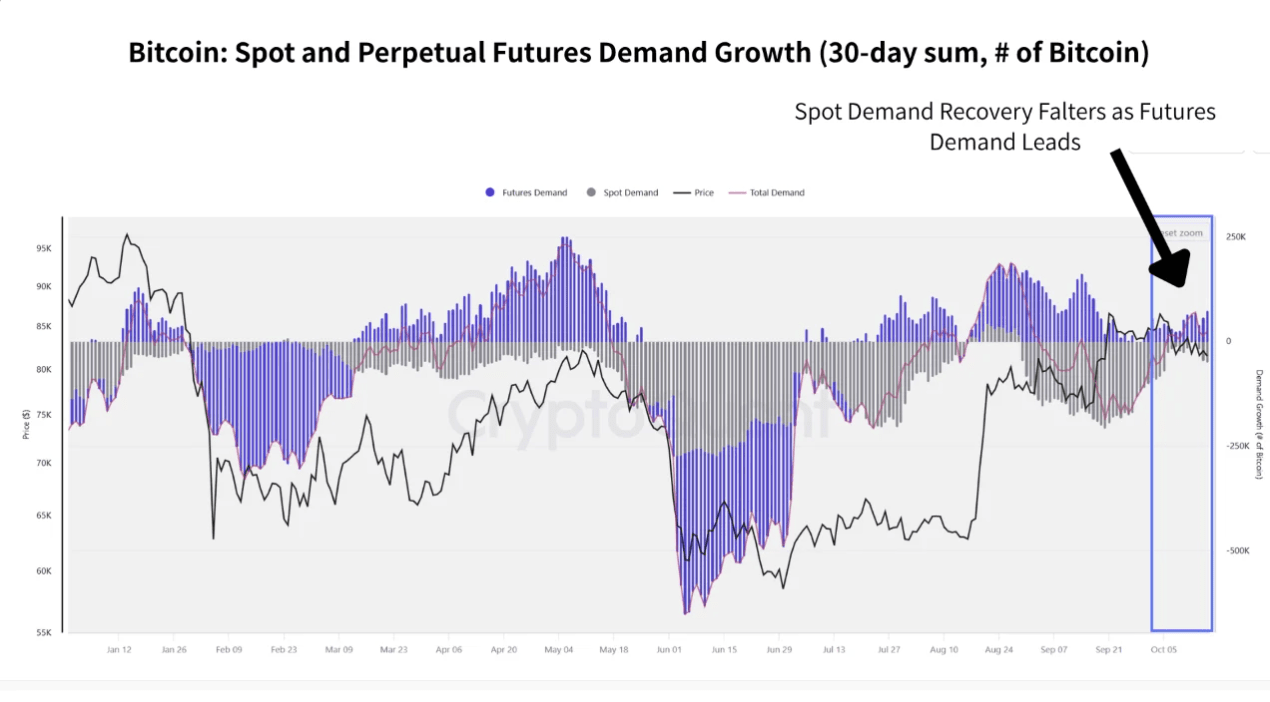
The 30-day demand measure moved toward zero before reversing into negative territory. What holds total demand up is positive perpetual futures demand.
That distinction is the single most important thing in the data. Futures demand is leveraged positioning; spot demand is someone buying and holding a coin. A market where the second is negative and the first is positive is being supported by contracts rather than by ownership.
Monday’s derivatives data says the same thing from an entirely separate dataset. Notional open interest grew faster than prices across Bitcoin, ether, solana and XRP, with positive funding on all four, while cumulative volume delta ran flat to negative — meaning aggressive selling at least matched aggressive buying. Two independent sources, one conclusion.
Note that this demand breakdown is not the Apparent Demand metric used in earlier analysis, and the two sets of values are not directly comparable.
Reserves Rose, but Barely
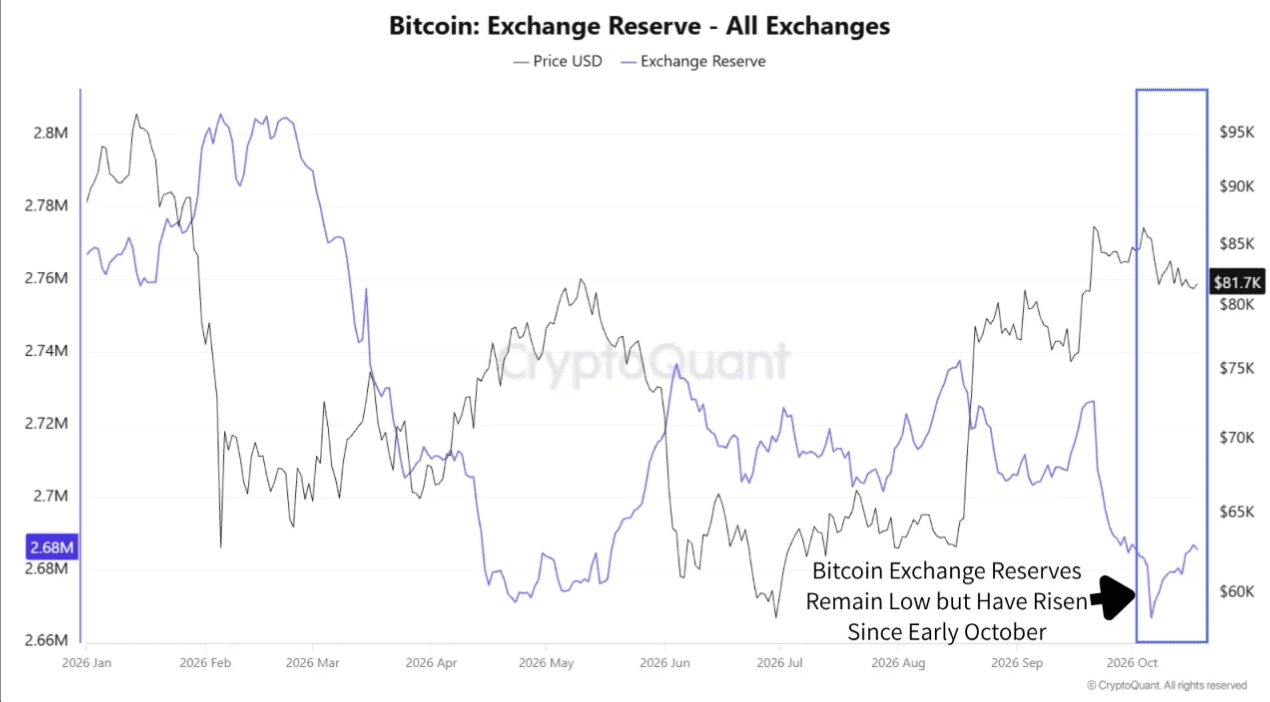
Exchange reserves increased from roughly 2.67 million BTC in early October to about 2.68 million — around 10,000 coins, or 0.37%.
In dollar terms that is about $825 million, which sounds substantial. As a share of a 2.67 million base, over roughly three weeks, it is close to noise. Reserves remain well below January levels and represent roughly 13% of circulating supply.
The interpretive caution matters more than the number. Rising reserves do not prove selling, because transfers between addresses can reflect custody changes rather than intent to sell. Sunday’s movement of 411 BTC from a wallet dormant since 2013 went to a new private address rather than to an exchange, which is the pattern most of these transfers follow.
One point of clarification for readers who follow both datasets: Galaxy Research’s supply attribution published on October 14 put trading platforms at 17.9% of supply, roughly 3.6 million BTC. That figure and CryptoQuant’s 2.68 million cover different entity sets and are not comparable.
The Whales Are Diverging by Size
Accumulation runs inverse to holder size, which is the opposite of what the phrase “whale accumulation” normally implies.
The 100 to 1,000 BTC cohort remains a net accumulator over 60 days, though below its late-September peak despite a modest rebound. The 1,000 to 10,000 BTC cohort is still net negative, with declines narrowing toward zero. The cohort above 10,000 BTC is negative outright.
So the smallest whales are buying, the mid-tier has nearly stopped selling, and the largest holders are still distributing. Accumulation is not broad-based, and it is narrowing rather than widening.
These are rolling 60-day figures that include pre-October activity, and they can reflect transfers between cohorts rather than new purchases — a wallet splitting a 15,000 BTC position into smaller addresses registers as the large cohort shrinking and the small cohort growing without a single coin changing hands.
Where the New Money Actually Sits
Short-term holders have added 422,000 BTC since their July 29 low, bringing holdings to 4.08 million, the most since mid-June. That is real new demand.
Two qualifications. The weekly pace has more than halved, from roughly 106,000 BTC to 48,000 in the most recent week. And the group’s average cost basis of $74,900 leaves it a cushion of about 10% against Bitcoin near $82,500 — an 8.8% decline would put the entire cohort underwater.
Long-term holders average $48,600 with a 72% cushion. The contrast describes who can absorb a drawdown and who cannot, and it explains why new supply turns over while old supply sits still.
The Scorecard
Three conditions were set out for a durable recovery. Their current status:
Condition | Status |
|---|---|
Sustained positive spot demand | Not met — turned negative again |
Buyers absorbing coins returning to exchanges | Arguably met — 10,000 BTC arrived, price held above $82,000 |
Accumulation spreading across holder groups | Not met — narrowing to the smallest cohort |
One of three. The conditions that remain unmet are the two that distinguish a base from a pause.
The Catalyst Is Now Live
The previous column framed the US midterms as an approaching catalyst. Early voting is now under way, which moves it from pending to active.
Monetary policy is the other variable. The Federal Reserve’s target range stands at 3.75% to 4.00%, with roughly a 15% chance of a hike at the October 28 meeting and near 90% for December.
Both of those are expectations. The question the data poses is whether they convert into purchases — and specifically into spot purchases, since that is the leg currently missing. Rallies supported by futures positioning unwind through the same mechanism that built them.