

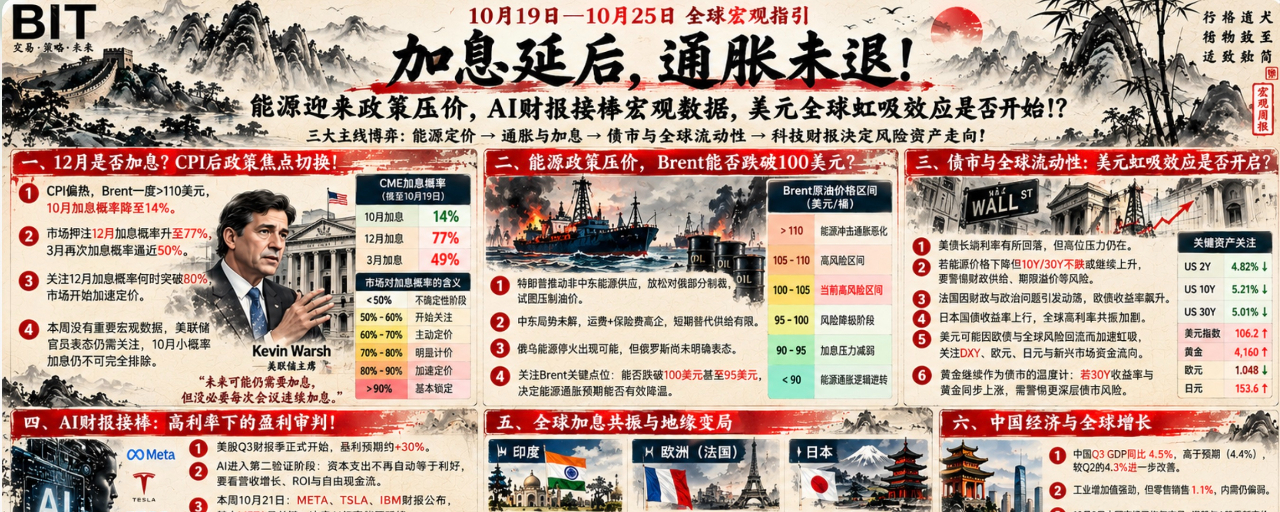

October 19–October 25 Global Macro Outlook: Rate Hikes Delayed, Inflation Persists! Energy Faces Policy-Driven Downward Price Pressure, AI Earnings Take Over from Macro Data—Is the Dollar’s Global Siphon Effect Beginning?!
Last week, the market focused on whether CPI would prompt a fresh reassessment of inflation, and on whether energy or the bond market would take the lead in price discovery?!
A week later, the market has its answer: CPI came in hotter than expected, Brent briefly topped $110, the probability of a rate hike in October fell to 14%, the odds of a December hike rose to 77%, and the probability of another hike in March edged toward 50%.
So as this week began, discussion of Fed policy shifted to whether there will be a rate hike in December, whether the market will start pricing one in if the odds rise above 80%, and how much will be priced in before the December policy meeting!
This week’s macro logic chain: #韩国KOSPI指数开盘跌3.17%
Inflation pressure → October rate hike shifts to December → Trump uses policy to suppress oil prices → Brent falls below $110 → Energy inflation expectations ease + bond yields fall → Long-term fiscal risks and term-premium risks remain → Valuation adjustments to Q3 tech earnings → AI profit growth vs. high capital expenditure vs. 5% risk-free rate → Direction of US stocks and BTC
First key theme — Will there be a rate hike in December?
So far, CME swap rates show the probability of an October rate hike has fallen to 14%. As the policy meeting approaches, an October hike is essentially off the table. The market is pricing in a December hike and another hike next March, with the probability of a December hike rising to 77%.
This means that all upcoming economic data will drive fluctuations in the probability of a December rate hike. The market needs to watch for when that probability breaks above 80%, triggering faster pricing.
A 70% probability indicates that a rate hike is expected with some certainty and is starting to be priced in. At 80%, pricing accelerates. At 90%, a December hike is essentially locked in and fully priced. Before the December policy meeting, we need to watch how much of the December hike has already been priced in. This will help us judge when we can look past the risk of a December hike and buy certain risk assets.

Second key theme — With a key midterm election milestone approaching, Trump is trying to use policy to suppress oil prices!
1. Since last week, the US has been releasing a steady stream of messages. It is clear that Trump wants energy from outside the Middle East to replace supplies passing through the Strait of Hormuz and ease the current rise in energy prices.
2. However, higher shipping and insurance costs caused by the prolonged US-Iran war, combined with the limited short-term impact of alternative supplies on energy supply, mean that I think it will be difficult for Brent to return to a low-risk range before November 3 unless Trump resolves the Iran issue.
3. To reiterate the energy pricing framework: above $110, markets are pricing in a worsening energy shock and inflation; $105–$110 is a high-risk range; $100–$105 is a phase in which elevated risks are easing and pressure is beginning to recede; $95–$100 is a risk downgrade phase; at $90–$95, energy puts less pressure on the Fed to hike rates; below $90, the energy-inflation narrative reverses.
4. So Brent is still in a high-risk range, continuing to weigh on bond markets and risk assets. Whether Trump can use policy to suppress crude prices remains uncertain. For now, don’t focus on the optimistic signals Trump is sending; prices better reflect the market’s true conditions. If prices fall below $100, or even below $95, that would be a significant positive for today’s risk markets.
Third key theme — US Treasury risks have temporarily eased, but risks in European and Japanese government bonds are growing. Could this trigger a global capital flight to the dollar?
1. Since last week, it has been clear that long-term US Treasury yields have been gradually declining. Brent’s fall below $110 today has pushed bond yields down further, easing pressure from long-term rates on risk assets.
2. However, note that the recent drop in short-term Treasury yields has actually been driven by liquidity being squeezed out of risk assets since last week. Investors are buying risk-free assets yielding 5% and selling risk assets, which remains unfavorable for risk assets in the short term.
3. Of course, if long-term yields are falling not mainly because bond prices are rising, but because inflation and energy pressures are easing, that would be a positive that loosens constraints on risk markets. The key question remains whether Brent can fall below $100, or even $95.
4. The chain of energy → inflation → Fed → US Treasuries → global liquidity remains intact. So the biggest positive for risk markets this week would be a fall in Brent accompanied by simultaneous declines in 2-year, 10-year, and 30-year Treasury yields. If the reverse happens—energy prices fall, but 10-year and 30-year yields stop falling or continue rising—we should be alert to potential fiscal and supply risks in the bond market.
5. Gold remains a key confirming asset. If 30-year yields rise while gold prices rise at the same time—or even accelerate upward—we should be wary of expanding risk exposure in the bond market itself.
6. Unrest in France has caused French government bond yields to surge. The underlying factors are also inflation pressure, political risk, and fiscal issues. If there is a lack of reliable information about the French bond market, the same situation could spread across Europe and trigger risks in European government bonds. Japanese government bond yields are also rising, but remain manageable for now.
7. Risks in Europe could accelerate the global flow of liquidity back into dollar assets, triggering the dollar’s global capital-siphoning effect. But if risks in European government bonds turn into a crisis, that would deliver a major shock to global risk assets and financial markets.
Fourth key theme — During a lull in macroeconomic data, US earnings take over as the market’s main driver of pricing!
1. The current situation in the US stock market is unusual. At the macro level, there is a tug-of-war between 5% risk-free yields and Q3 earnings reports. With macro pressure still running high, Q3 earnings season is becoming more challenging for every company.
2. Asian markets came under further pressure from AI today. Reuters reported that the market is still worried about whether all the money being invested in AI can actually be earned back. In fact, Q2 earnings have gradually confirmed that the business case for AI investment returns can be validated. So why are investors still worried in Q3? The key reason is that macro pressure is so intense, making money more expensive for investors. As a result, they are more cautious about current market and stock valuations.
3. This also means that Q3 earnings season has officially entered the second phase of AI validation. The focus has shifted from “AI capital expenditure equals good news” to: AI capital investment → Where will the money come from? → What will the ROI be? → What will happen to free cash flow? → Can profit growth cover the costs? So for Q3 earnings, bigger capital expenditure is not necessarily better; it needs to create a virtuous cycle.
4. For Q3 earnings, every tech company needs to answer a key question from investors: If an AI project costs $10 billion, why should I take such a big risk and invest in it instead of choosing an asset with a risk-free return of 5%?
5. So this Q3 earnings season, the core focus is “cost of capital.” In company reports, that means looking at four key factors: revenue growth, AI capital expenditure, free cash flow, and 2027 guidance—not just EPS.
6. This week’s key earnings date is October 21, when META and TSLA will report. IBM is also reporting that day. The main focus is META: Does its report show stronger revenue to support greater AI infrastructure investment? Does advertising ROI further validate the business case for AI capital expenditure? And what does it show about operating margins and 2027 capital guidance? META is a key test of confidence in AI this week. By comparison, TSLA and IBM carry less weight.
7. In my view, the best outcome for META’s earnings would be continued growth in AI capital expenditure, supported by stronger ad revenue and profit growth. If all of these exceed expectations, that could be a potential positive for both upstream and downstream companies in the AI industry chain. But if capital expenditure keeps expanding without revenue and ad revenue keeping pace, we should be wary of further valuation adjustments by the market.
Summary of this week’s framework:
We are clearly in a phase where macro pressure is battling earnings performance. On the macro side, watch whether Brent can fall below $100, with $95 as a key level. If macro pressure does not ease, earnings will be more challenging for tech companies. Even reports that beat expectations may struggle to reverse the market’s short-term trend outright.
Conversely, if Brent quickly falls below $95 and META reports in line with expectations without crossing the “red line” on capital expenditure, US stocks could perform well in the short term, potentially even driving a simultaneous rebound and breakout in #Bitcoin.
This week will perfectly illustrate the point I made earlier: macro conditions determine how expensive money is, while earnings determine whether investors are willing to pay for current valuations!