

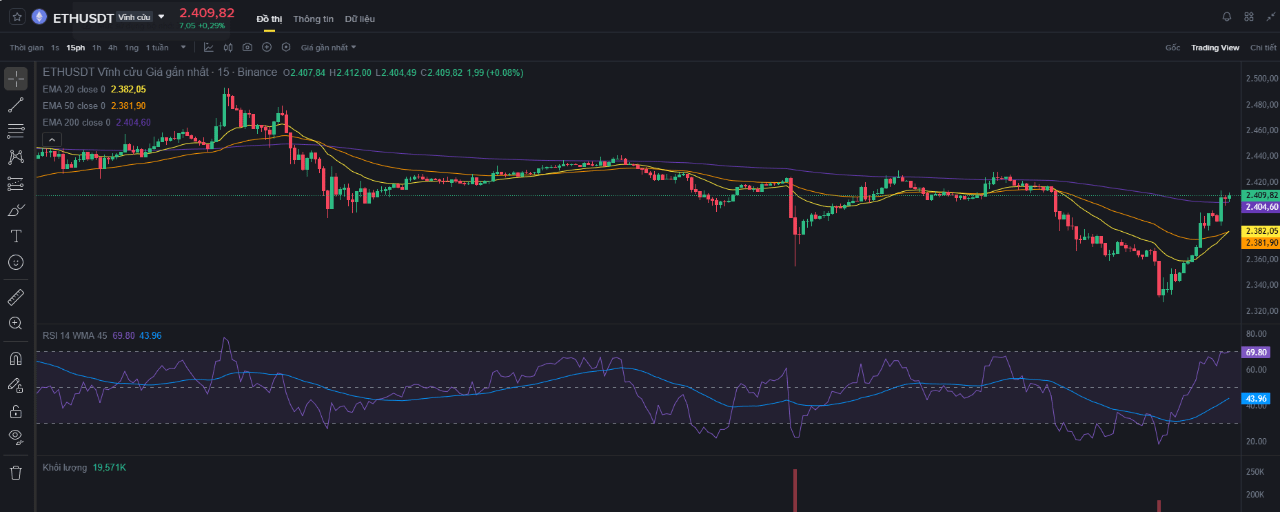

After the recent correction from the short-term peak of $2,800, Ethereum (ETH) has officially entered a sensitive price zone and received strong support from dip-buying flows. Using a multi-timeframe analysis approach, let’s examine the current technical landscape and develop a disciplined trading plan with an optimal Risk:Reward (R:R) ratio.
1. DAILY TIMEFRAME (D1) — A MAJOR RESISTANCE LEVEL
Dynamic support confirmation: On the daily chart, ETH’s decline stalled right at the 200 EMA (around $2,311). This is one of the most important long-term moving averages, serving as the dividing line between long-term bullish and bearish trends.
Candlestick signal: A clear rejection candle with a long lower wick appeared in the $2,310–$2,350 support zone.
Momentum indicator: RSI(14) came close to the oversold threshold (~38.0) and began curving upward, indicating that selling pressure had clearly weakened.
Daily timeframe conclusion: BUY bias preferred. The D1 200 EMA support is proving effective.
2. 4-HOUR TIMEFRAME (H4) — STRATEGIC ZONE IDENTIFICATION
Successful liquidity sweep: The H4 chart recorded a sharp wick down into the $2,310 zone before rebounding strongly, leaving a convincing pin bar with a long lower wick.
Demand zone: The $2,340–$2,380 area has now become a solid short-term support zone.
Upside potential: The H4 200 EMA is currently at $2,525, leaving ample room to run for this recovery move.
H4 timeframe conclusion: The ideal trading zone is $2,370–$2,390.
3. 1-HOUR TIMEFRAME (H1) — STRUCTURE REVERSAL SETUP
Break of bearish structure (BOS): An impulsive green candle has just appeared on H1, pushing price above the EMA 20 ($2,388) and EMA 50 ($2,403) cluster and closing firmly above $2,409.
Momentum confirmation: This price action confirms a higher low and officially ends the short-term downtrend.
H1 timeframe conclusion: A textbook BUY setup has formed.
4. 15-MINUTE TIMEFRAME (M15) — ENTRY CONFIRMATION & MANAGEMENT
The M15 bullish impulse pushed RSI into overbought territory (>69). To stay disciplined and avoid the FOMO trap at the top of an M15 candle, the optimal strategy is to patiently wait for a pullback/retest of the support zone that was just broken.
DETAILED TRADE PLAN
Strategy: Limit BUY / Retest BUY
Entry zone: $2,380–$2,395 (M15 200 EMA retest zone and the minor resistance just broken)
Stop Loss (SL): $2,335 (Placed safely below the H1/M15 liquidity-sweep candle low)
Take Profit (TP):
TP1: $2,455 (H4 EMA 50 resistance)
TP2: $2,520 (H4 200 EMA resistance)
Risk : Reward ratio: > 2.36
