


The crypto market is entering a critical period of volatility following a consolidation phase around the $80,000–$82,000 price range. Amid the countless noisy signals in the market, following a disciplined multi-timeframe analysis process (Top-Down Analysis) is the only key to helping traders stay disciplined and optimize their profits.
Below is a detailed analysis of the money flow context from the daily chart down to M15 for BTCUSDT, along with a practical trading plan with an optimal R:R ratio for October 19, 2026.
1. DAILY TIMEFRAME (D1) — ESTABLISHING THE PRIMARY DIRECTION
Overall trend: The uptrend structure on the daily timeframe remains firmly in control, with a sequence of higher highs and higher lows (HH + HL).
Current price action: After a strong breakout to a short-term high around ~$87,500, BTC has entered a reasonable correction to retest dynamic support — the 50 EMA (around $80,488).
Position assessment: Price is still trading well above the 200 EMA (around $75,872), confirming that long-term buying pressure remains intact.
📌 Daily timeframe conclusion: BUY bias (favor long positions). Absolutely do not jump into a countertrend SELL position at this stage.
2. 4-HOUR TIMEFRAME (H4) — IDENTIFYING THE STRATEGIC LOCATION
Trend alignment: H4 recorded a strong rejection wick upon reaching the key Demand Zone at $80,800–$81,200.
Structure & indicators: Price is attempting to form a higher low and cross back above the 20/50 EMA cluster.
Room to run: There is plenty of space above to the next short-term resistance zone around $84,500–$85,000, creating favorable conditions for a trade with an excellent Risk:Reward (R:R) ratio.
📌 H4 conclusion: The trading zone has been clearly identified at $80,800–$81,500.
3. 1-HOUR TIMEFRAME (H1) — LOOKING FOR A TRADEABLE SETUP
Money flow confirmation: The H1 chart shows a decisive bullish candle with a solid body (Impulse Move), closing above both the 20 EMA and 50 EMA (around $82,073).
Break of Structure (BOS): This upward move officially breaks the previous short-term downtrend, confirming that buying pressure has returned and is dominant.
Momentum: The H1 RSI(14) surged to 61.7, reflecting strongly increasing buying momentum.
📌 H1 conclusion: A textbook BUY setup has appeared.
4. 15-MINUTE TIMEFRAME (M15) — CONFIRMATION & EXECUTION
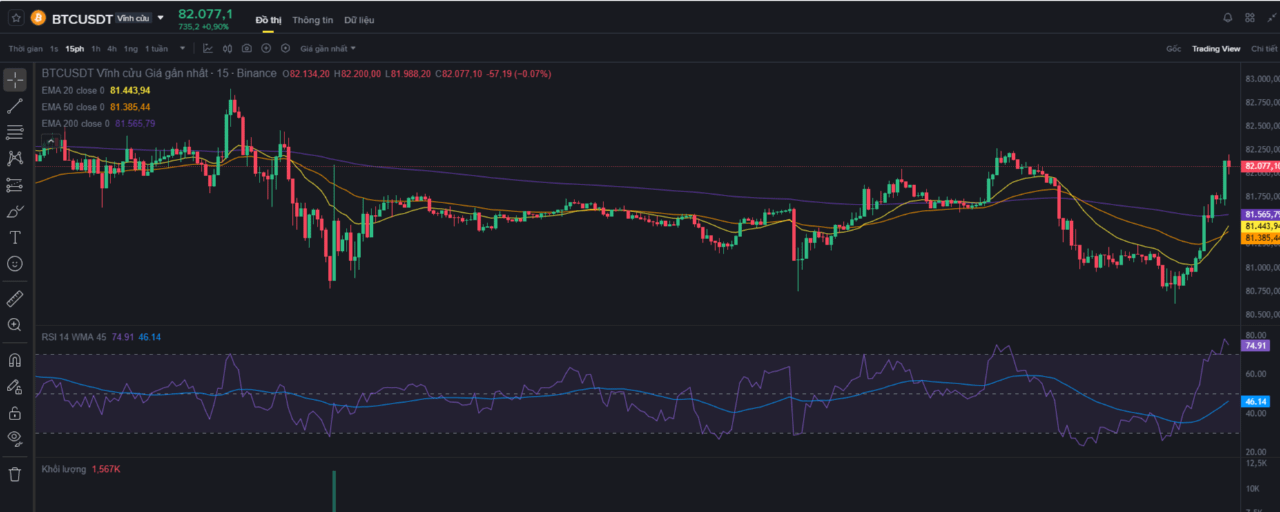
On the M15 timeframe, a sharp bullish candle shows strong short-term buying pressure (RSI > 77). The core principle of disciplined trading: Do not chase the price (FOMO) at the M15 candle high. Instead, patiently wait for a pullback/retest to the support zone that was just broken.
🎯 DETAILED TRADING PLAN
Strategy: Limit BUY / Market BUY when price pulls back to the confirmation zone
Entry zone: $81,500–$81,700 (M15 EMA retest zone & newly broken support)
Stop Loss (SL): $80,450 (Placed below the most recent H1/M15 reaction low to avoid being stopped out by a wick)
Take Profit (TP):
TP1: $84,000 (Nearest H4 resistance)
TP2: $85,500–$86,000 (Key previous high)
R:R ratio: > 2.15
